29
/
en
AIzaSyAYiBZKx7MnpbEhh9jyipgxe19OcubqV5w
April 1, 2024
26047
Central Europe and the Baltics
CEB
false
2
1
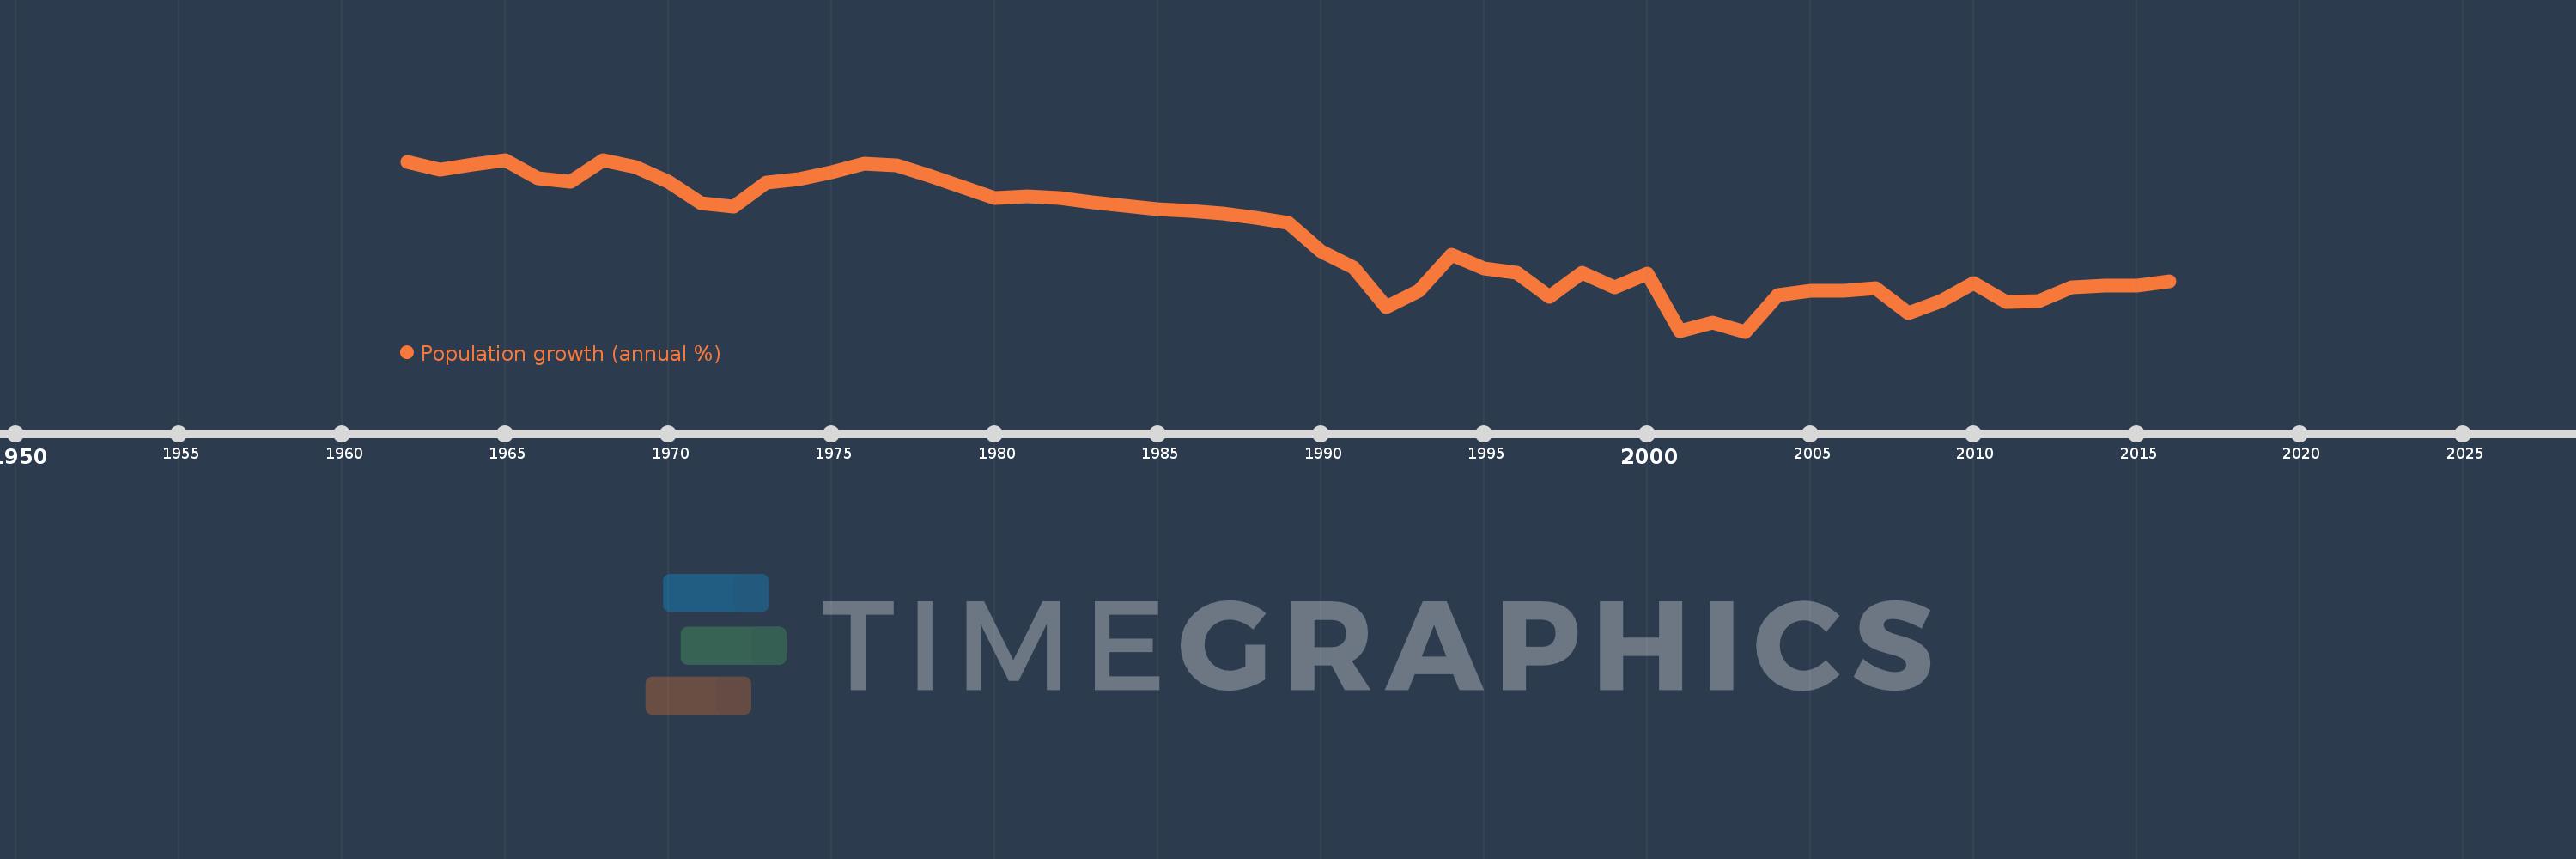
Population growth (annual %)
2016,2015,2014,2013,2012,2011,2010,2009,2008,2007,2006,2005,2004,2003,2002,2001,2000,1999,1998,1997,1996,1995,1994,1993,1992,1991,1990,1989,1988,1987,1986,1985,1984,1983,1982,1981,1980,1979,1978,1977,1976,1975,1974,1973,1972,1971,1970,1969,1968,1967,1966,1965,1964,1963,1962
This statistics in other country:
AfghanistanAlbaniaAlgeriaAmerican SamoaAndorraAngolaAntigua and BarbudaArab WorldArgentinaArmeniaArubaAustraliaAustriaAzerbaijanBahamas, TheBahrainBangladeshBarbadosBelarusBelgiumBelizeBeninBermudaBhutanBoliviaBosnia and HerzegovinaBotswanaBrazilBritish Virgin IslandsBrunei DarussalamBulgariaBurkina FasoBurundiCabo VerdeCambodiaCameroonCanadaCaribbean small statesCayman IslandsCentral African RepublicCentral Europe and the BalticsChadChannel IslandsChileChinaColombiaComorosCongo, Dem. Rep.Congo, Rep.Costa RicaCote d'IvoireCroatiaCubaCuracaoCyprusCzech RepublicDenmarkDjiboutiDominicaDominican RepublicEarly-demographic dividendEast Asia & PacificEast Asia & Pacific (excluding high income)East Asia & Pacific (IDA & IBRD countries)EcuadorEgypt, Arab Rep.El SalvadorEquatorial GuineaEritreaEstoniaEthiopiaEuro areaEurope & Central AsiaEurope & Central Asia (excluding high income)Europe & Central Asia (IDA & IBRD countries)European UnionFaroe IslandsFijiFinlandFragile and conflict affected situationsFranceFrench PolynesiaGabonGambia, TheGeorgiaGermanyGhanaGibraltarGreeceGreenlandGrenadaGuamGuatemalaGuineaGuinea-BissauGuyanaHaitiHeavily indebted poor countries (HIPC)High incomeHondurasHong Kong SAR, ChinaHungaryIBRD onlyIcelandIDA & IBRD totalIDA blendIDA onlyIDA totalIndiaIndonesiaIran, Islamic Rep.IraqIrelandIsle of ManIsraelItalyJamaicaJapanJordanKazakhstanKenyaKiribatiKorea, Dem. People’s Rep.Korea, Rep.KosovoKuwaitKyrgyz RepublicLao PDRLate-demographic dividendLatin America & Caribbean Latin America & Caribbean (excluding high income)Latin America & the Caribbean (IDA & IBRD countries)LatviaLeast developed countries: UN classificationLebanonLesothoLiberiaLibyaLiechtensteinLithuaniaLow & middle incomeLow incomeLower middle incomeLuxembourgMacao SAR, ChinaMacedonia, FYRMadagascarMalawiMalaysiaMaldivesMaliMaltaMarshall IslandsMauritaniaMauritiusMexicoMicronesia, Fed. Sts.Middle East & North AfricaMiddle East & North Africa (excluding high income)Middle East & North Africa (IDA & IBRD countries)Middle incomeMoldovaMonacoMongoliaMontenegroMoroccoMozambiqueMyanmarNamibiaNauruNepalNetherlandsNew CaledoniaNew ZealandNicaraguaNigerNigeriaNorth AmericaNorthern Mariana IslandsNorwayOECD membersOmanOther small statesPacific island small statesPakistanPalauPanamaPapua New GuineaParaguayPeruPhilippinesPolandPortugalPost-demographic dividendPre-demographic dividendPuerto RicoQatarRomaniaRussian FederationRwandaSamoaSan MarinoSao Tome and PrincipeSaudi ArabiaSenegalSerbiaSeychellesSierra LeoneSingaporeSint Maarten (Dutch part)Slovak RepublicSloveniaSmall statesSolomon IslandsSomaliaSouth AfricaSouth AsiaSouth Asia (IDA & IBRD)South SudanSpainSri LankaSt. Kitts and NevisSt. LuciaSt. Martin (French part)St. Vincent and the GrenadinesSub-Saharan Africa Sub-Saharan Africa (excluding high income)Sub-Saharan Africa (IDA & IBRD countries)SudanSurinameSwazilandSwedenSwitzerlandSyrian Arab RepublicTajikistanTanzaniaThailandTimor-LesteTogoTongaTrinidad and TobagoTunisiaTurkeyTurkmenistanTurks and Caicos IslandsTuvaluUgandaUkraineUnited Arab EmiratesUnited KingdomUnited StatesUpper middle incomeUruguayUzbekistanVanuatuVenezuela, RBVietnamVirgin Islands (U.S.)West Bank and GazaWorldYemen, Rep.ZambiaZimbabwe Timeline:
This timeline shows a graph from 1962 to 2016 of Central Europe and the Baltics. No data until 1961. Number of actual observations by date: 55.
Source name:
World Development Indicators
Source organization:
Derived from total population. Population source: (1) United Nations Population Division. World Population Prospects, (2) United Nations Statistical Division. Population and Vital Statistics Report (various years), (3) Census reports and other statistical
Categories, topics:
Climate Change, Health
Last updated:
apr 23, 2017
Indicators value changes by year
Minimum:
-0.633
jan 1, 2003
At the date of observation
Value
Absolute change
Change from previous value
jan 1, 1962
0.914
+0.914
0.0%
jan 1, 1963
0.843
-0.071
-7.76%
jan 1, 1964
0.893
+0.05
5.93%
jan 1, 1965
0.934
+0.041
4.6%
jan 1, 1966
0.765
-0.17
-18.14%
jan 1, 1967
0.735
-0.03
-3.9%
jan 1, 1968
0.931
+0.196
26.63%
jan 1, 1969
0.864
-0.066
-7.14%
jan 1, 1970
0.735
-0.129
-14.93%
jan 1, 1971
0.539
-0.197
-26.74%
jan 1, 1972
0.51
-0.029
-5.31%
jan 1, 1973
0.727
+0.217
42.57%
jan 1, 1974
0.754
+0.027
3.7%
jan 1, 1975
0.817
+0.062
8.27%
jan 1, 1976
0.899
+0.082
10.06%
jan 1, 1977
0.882
-0.016
-1.82%
jan 1, 1978
0.789
-0.093
-10.54%
jan 1, 1979
0.684
-0.106
-13.4%
jan 1, 1980
0.589
-0.094
-13.8%
jan 1, 1981
0.604
+0.015
2.54%
jan 1, 1982
0.585
-0.02
-3.24%
jan 1, 1983
0.544
-0.041
-7.01%
jan 1, 1984
0.516
-0.028
-5.1%
jan 1, 1985
0.486
-0.03
-5.85%
jan 1, 1986
0.466
-0.02
-4.11%
jan 1, 1987
0.445
-0.021
-4.44%
jan 1, 1988
0.409
-0.036
-8.07%
jan 1, 1989
0.355
-0.054
-13.19%
jan 1, 1990
0.102
-0.253
-71.3%
jan 1, 1991
-0.05
-0.152
-149.24%
jan 1, 1992
-0.411
-0.361
719.03%
jan 1, 1993
-0.258
+0.153
-37.19%
jan 1, 1994
0.069
+0.327
-126.69%
jan 1, 1995
-0.056
-0.125
-181.57%
jan 1, 1996
-0.097
-0.04
71.94%
jan 1, 1997
-0.319
-0.222
229.52%
jan 1, 1998
-0.095
+0.224
-70.2%
jan 1, 1999
-0.23
-0.135
142.42%
jan 1, 2000
-0.105
+0.125
-54.45%
jan 1, 2001
-0.63
-0.525
500.94%
jan 1, 2002
-0.548
+0.082
-13.02%
jan 1, 2003
-0.633
-0.085
15.56%
jan 1, 2004
-0.299
+0.335
-52.84%
jan 1, 2005
-0.261
+0.038
-12.65%
jan 1, 2006
-0.259
+0.002
-0.77%
jan 1, 2007
-0.24
+0.018
-7.14%
jan 1, 2008
-0.467
-0.226
94.22%
jan 1, 2009
-0.358
+0.109
-23.28%
jan 1, 2010
-0.192
+0.166
-46.26%
jan 1, 2011
-0.363
-0.17
88.47%
jan 1, 2012
-0.354
+0.009
-2.49%
jan 1, 2013
-0.229
+0.125
-35.21%
jan 1, 2014
-0.213
+0.016
-6.96%
jan 1, 2015
-0.21
+0.003
-1.62%
jan 1, 2016
-0.172
+0.038
-18.22%
Ranking of countries by current statistics by years


Comments: