29
/
en
AIzaSyAYiBZKx7MnpbEhh9jyipgxe19OcubqV5w
April 1, 2024
187006
Malawi
MWI
true
2
1
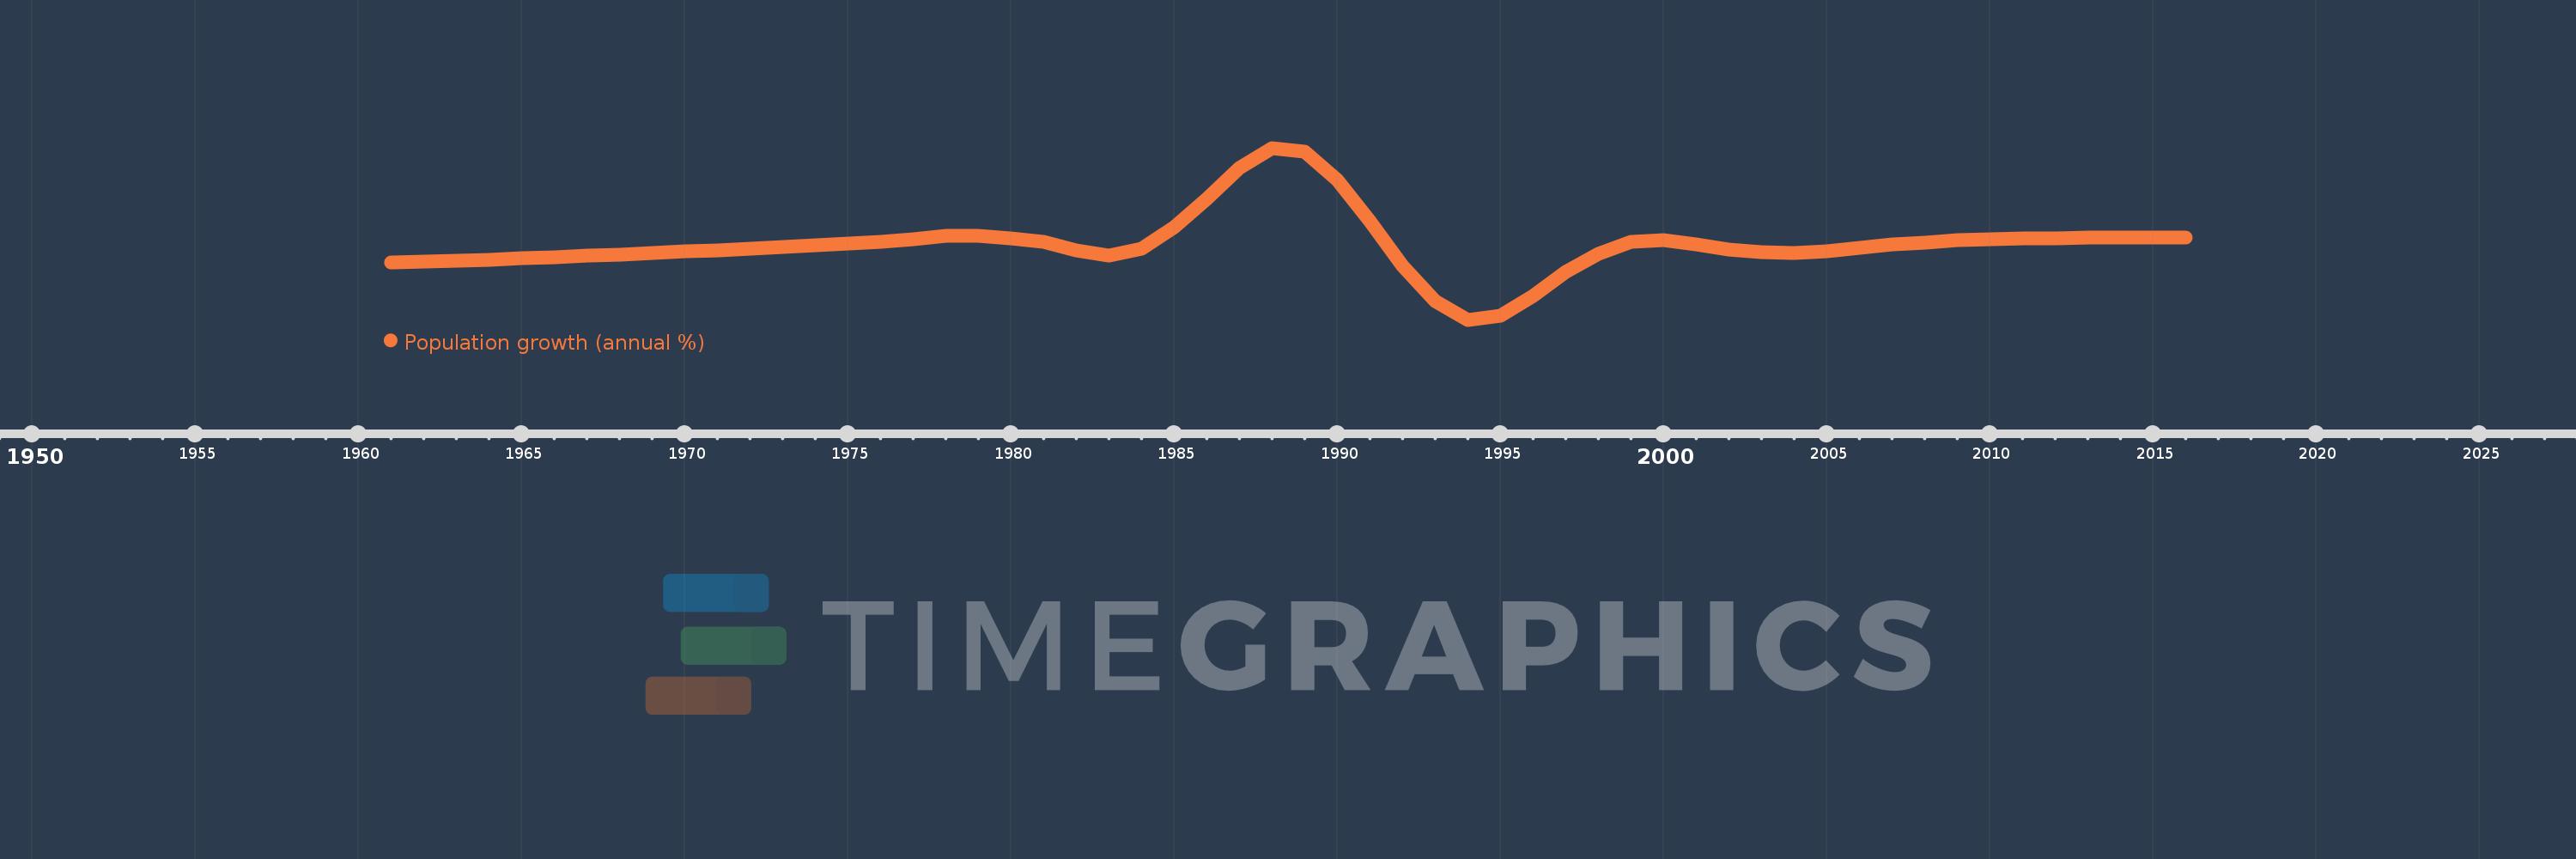
Population growth (annual %)
2016,2015,2014,2013,2012,2011,2010,2009,2008,2007,2006,2005,2004,2003,2002,2001,2000,1999,1998,1997,1996,1995,1994,1993,1992,1991,1990,1989,1988,1987,1986,1985,1984,1983,1982,1981,1980,1979,1978,1977,1976,1975,1974,1973,1972,1971,1970,1969,1968,1967,1966,1965,1964,1963,1962,1961
This statistics in other country:
AfghanistanAlbaniaAlgeriaAmerican SamoaAndorraAngolaAntigua and BarbudaArab WorldArgentinaArmeniaArubaAustraliaAustriaAzerbaijanBahamas, TheBahrainBangladeshBarbadosBelarusBelgiumBelizeBeninBermudaBhutanBoliviaBosnia and HerzegovinaBotswanaBrazilBritish Virgin IslandsBrunei DarussalamBulgariaBurkina FasoBurundiCabo VerdeCambodiaCameroonCanadaCaribbean small statesCayman IslandsCentral African RepublicCentral Europe and the BalticsChadChannel IslandsChileChinaColombiaComorosCongo, Dem. Rep.Congo, Rep.Costa RicaCote d'IvoireCroatiaCubaCuracaoCyprusCzech RepublicDenmarkDjiboutiDominicaDominican RepublicEarly-demographic dividendEast Asia & PacificEast Asia & Pacific (excluding high income)East Asia & Pacific (IDA & IBRD countries)EcuadorEgypt, Arab Rep.El SalvadorEquatorial GuineaEritreaEstoniaEthiopiaEuro areaEurope & Central AsiaEurope & Central Asia (excluding high income)Europe & Central Asia (IDA & IBRD countries)European UnionFaroe IslandsFijiFinlandFragile and conflict affected situationsFranceFrench PolynesiaGabonGambia, TheGeorgiaGermanyGhanaGibraltarGreeceGreenlandGrenadaGuamGuatemalaGuineaGuinea-BissauGuyanaHaitiHeavily indebted poor countries (HIPC)High incomeHondurasHong Kong SAR, ChinaHungaryIBRD onlyIcelandIDA & IBRD totalIDA blendIDA onlyIDA totalIndiaIndonesiaIran, Islamic Rep.IraqIrelandIsle of ManIsraelItalyJamaicaJapanJordanKazakhstanKenyaKiribatiKorea, Dem. People’s Rep.Korea, Rep.KosovoKuwaitKyrgyz RepublicLao PDRLate-demographic dividendLatin America & Caribbean Latin America & Caribbean (excluding high income)Latin America & the Caribbean (IDA & IBRD countries)LatviaLeast developed countries: UN classificationLebanonLesothoLiberiaLibyaLiechtensteinLithuaniaLow & middle incomeLow incomeLower middle incomeLuxembourgMacao SAR, ChinaMacedonia, FYRMadagascarMalawiMalaysiaMaldivesMaliMaltaMarshall IslandsMauritaniaMauritiusMexicoMicronesia, Fed. Sts.Middle East & North AfricaMiddle East & North Africa (excluding high income)Middle East & North Africa (IDA & IBRD countries)Middle incomeMoldovaMonacoMongoliaMontenegroMoroccoMozambiqueMyanmarNamibiaNauruNepalNetherlandsNew CaledoniaNew ZealandNicaraguaNigerNigeriaNorth AmericaNorthern Mariana IslandsNorwayOECD membersOmanOther small statesPacific island small statesPakistanPalauPanamaPapua New GuineaParaguayPeruPhilippinesPolandPortugalPost-demographic dividendPre-demographic dividendPuerto RicoQatarRomaniaRussian FederationRwandaSamoaSan MarinoSao Tome and PrincipeSaudi ArabiaSenegalSerbiaSeychellesSierra LeoneSingaporeSint Maarten (Dutch part)Slovak RepublicSloveniaSmall statesSolomon IslandsSomaliaSouth AfricaSouth AsiaSouth Asia (IDA & IBRD)South SudanSpainSri LankaSt. Kitts and NevisSt. LuciaSt. Martin (French part)St. Vincent and the GrenadinesSub-Saharan Africa Sub-Saharan Africa (excluding high income)Sub-Saharan Africa (IDA & IBRD countries)SudanSurinameSwazilandSwedenSwitzerlandSyrian Arab RepublicTajikistanTanzaniaThailandTimor-LesteTogoTongaTrinidad and TobagoTunisiaTurkeyTurkmenistanTurks and Caicos IslandsTuvaluUgandaUkraineUnited Arab EmiratesUnited KingdomUnited StatesUpper middle incomeUruguayUzbekistanVanuatuVenezuela, RBVietnamVirgin Islands (U.S.)West Bank and GazaWorldYemen, Rep.ZambiaZimbabwe Timeline:
This timeline shows a graph from 1961 to 2016 of Malawi. No data until 1960. Number of actual observations by date: 56.
Source name:
World Development Indicators
Source organization:
Derived from total population. Population source: (1) United Nations Population Division. World Population Prospects, (2) United Nations Statistical Division. Population and Vital Statistics Report (various years), (3) Census reports and other statistical
Categories, topics:
Climate Change, Health
Last updated:
apr 23, 2017
Indicators value changes by year
At the date of observation
Value
Absolute change
Change from previous value
jan 1, 1961
2.197
+2.197
0.0%
jan 1, 1962
2.225
+0.028
1.3%
jan 1, 1963
2.256
+0.03
1.37%
jan 1, 1964
2.29
+0.035
1.54%
jan 1, 1965
2.331
+0.04
1.75%
jan 1, 1966
2.375
+0.044
1.91%
jan 1, 1967
2.421
+0.046
1.93%
jan 1, 1968
2.468
+0.047
1.93%
jan 1, 1969
2.517
+0.05
2.02%
jan 1, 1970
2.57
+0.053
2.1%
jan 1, 1971
2.625
+0.055
2.14%
jan 1, 1972
2.678
+0.053
2.01%
jan 1, 1973
2.73
+0.052
1.94%
jan 1, 1974
2.786
+0.056
2.05%
jan 1, 1975
2.846
+0.06
2.17%
jan 1, 1976
2.908
+0.061
2.15%
jan 1, 1977
3.015
+0.108
3.7%
jan 1, 1978
3.121
+0.106
3.52%
jan 1, 1979
3.138
+0.016
0.52%
jan 1, 1980
3.044
-0.094
-3.0%
jan 1, 1981
2.907
-0.137
-4.49%
jan 1, 1982
2.628
-0.279
-9.6%
jan 1, 1983
2.439
-0.189
-7.19%
jan 1, 1984
2.677
+0.238
9.74%
jan 1, 1985
3.44
+0.763
28.52%
jan 1, 1986
4.443
+1.003
29.14%
jan 1, 1987
5.554
+1.111
25.01%
jan 1, 1988
6.251
+0.697
12.56%
jan 1, 1989
6.128
-0.123
-1.96%
jan 1, 1990
5.112
-1.017
-16.59%
jan 1, 1991
3.635
-1.476
-28.88%
jan 1, 1992
2.053
-1.582
-43.52%
jan 1, 1993
0.816
-1.237
-60.25%
jan 1, 1994
0.152
-0.664
-81.39%
jan 1, 1995
0.288
+0.136
89.68%
jan 1, 1996
0.994
+0.706
245.21%
jan 1, 1997
1.855
+0.861
86.57%
jan 1, 1998
2.503
+0.648
34.92%
jan 1, 1999
2.912
+0.408
16.31%
jan 1, 2000
2.975
+0.063
2.18%
jan 1, 2001
2.815
-0.16
-5.38%
jan 1, 2002
2.633
-0.182
-6.47%
jan 1, 2003
2.551
-0.082
-3.11%
jan 1, 2004
2.527
-0.023
-0.92%
jan 1, 2005
2.589
+0.062
2.45%
jan 1, 2006
2.705
+0.116
4.48%
jan 1, 2007
2.819
+0.114
4.23%
jan 1, 2008
2.901
+0.082
2.9%
jan 1, 2009
2.966
+0.064
2.22%
jan 1, 2010
3.006
+0.041
1.38%
jan 1, 2011
3.03
+0.023
0.77%
jan 1, 2012
3.047
+0.017
0.58%
jan 1, 2013
3.063
+0.016
0.52%
jan 1, 2014
3.071
+0.008
0.27%
jan 1, 2015
3.072
+0.001
0.03%
jan 1, 2016
3.067
-0.005
-0.17%
Ranking of countries by current statistics by years


Comments: