29
/
en
AIzaSyAYiBZKx7MnpbEhh9jyipgxe19OcubqV5w
April 1, 2024
59268
Sub-Saharan Africa
SSF
false
2
1
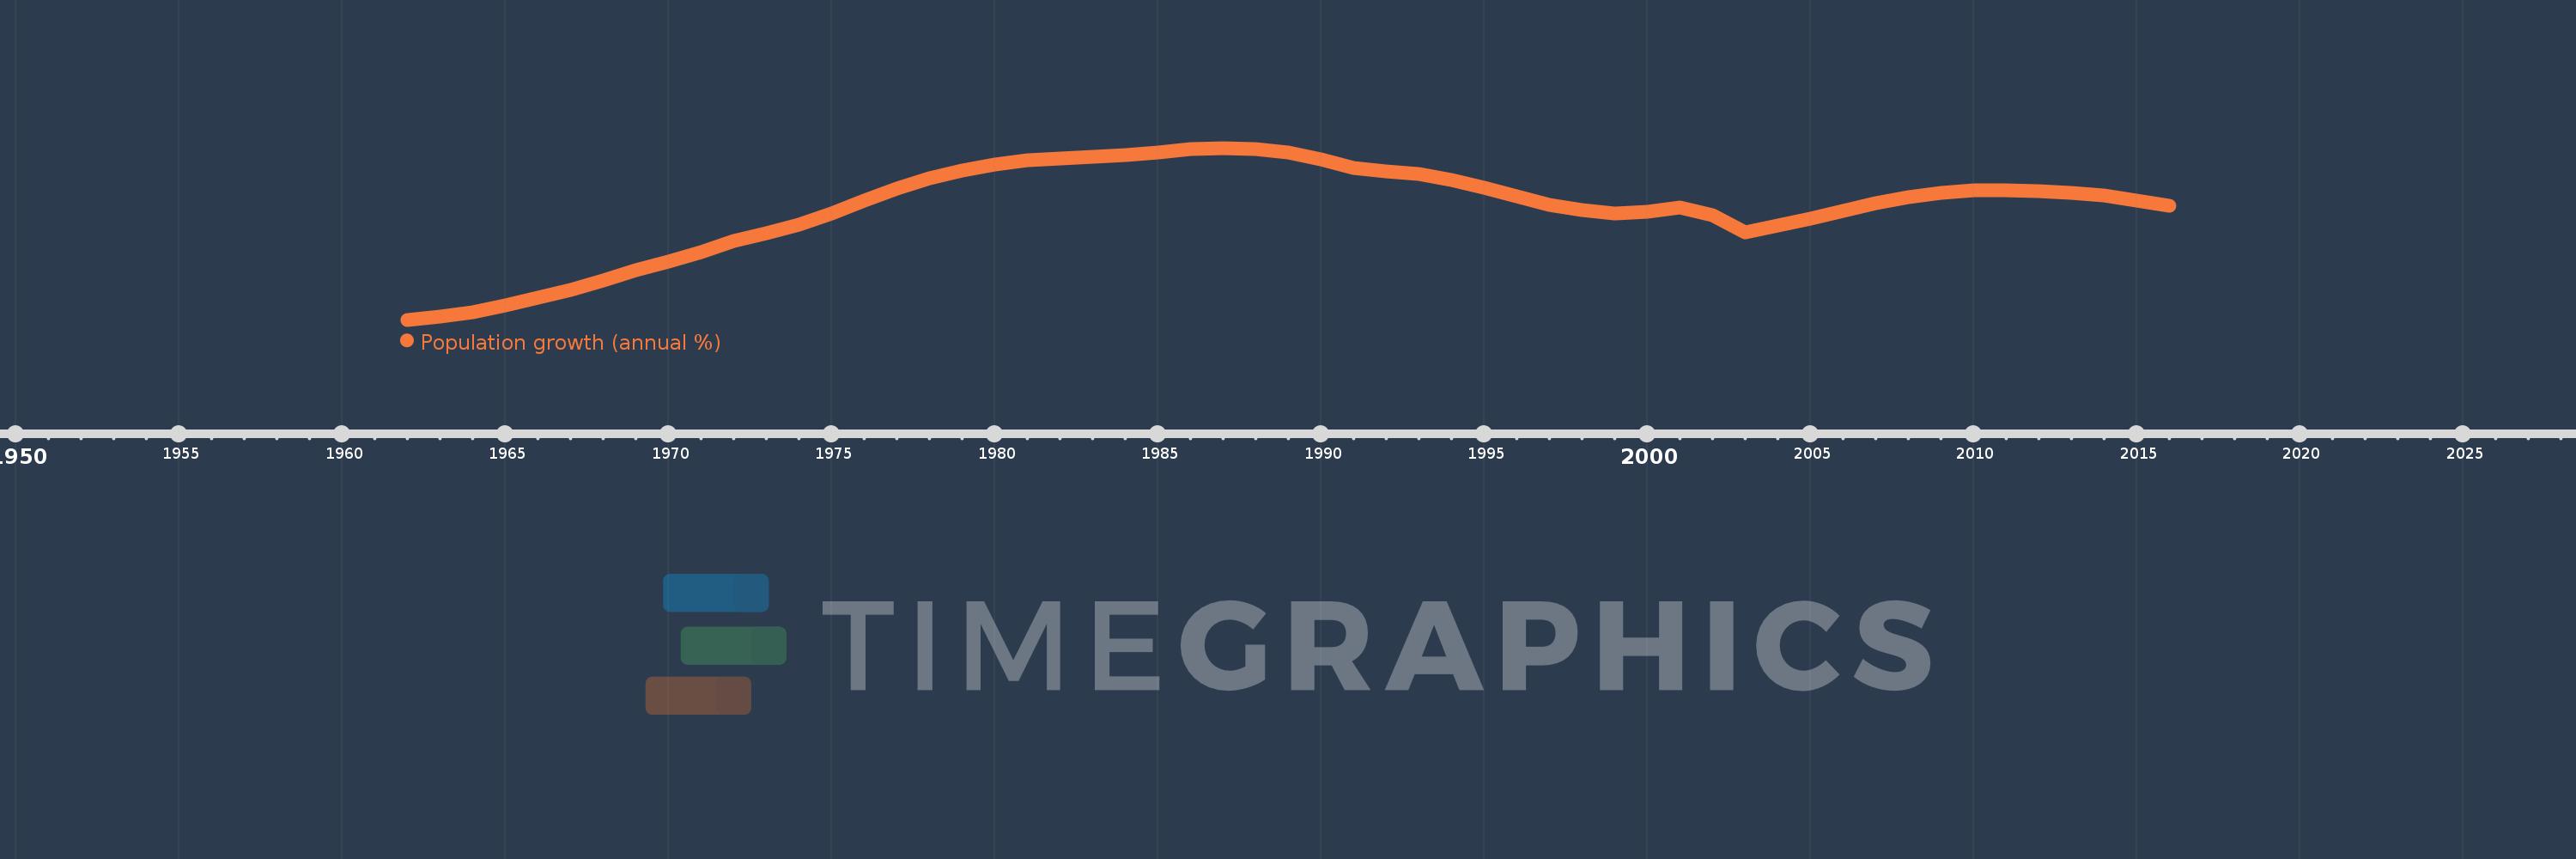
Population growth (annual %)
2016,2015,2014,2013,2012,2011,2010,2009,2008,2007,2006,2005,2004,2003,2002,2001,2000,1999,1998,1997,1996,1995,1994,1993,1992,1991,1990,1989,1988,1987,1986,1985,1984,1983,1982,1981,1980,1979,1978,1977,1976,1975,1974,1973,1972,1971,1970,1969,1968,1967,1966,1965,1964,1963,1962
This statistics in other country:
AfghanistanAlbaniaAlgeriaAmerican SamoaAndorraAngolaAntigua and BarbudaArab WorldArgentinaArmeniaArubaAustraliaAustriaAzerbaijanBahamas, TheBahrainBangladeshBarbadosBelarusBelgiumBelizeBeninBermudaBhutanBoliviaBosnia and HerzegovinaBotswanaBrazilBritish Virgin IslandsBrunei DarussalamBulgariaBurkina FasoBurundiCabo VerdeCambodiaCameroonCanadaCaribbean small statesCayman IslandsCentral African RepublicCentral Europe and the BalticsChadChannel IslandsChileChinaColombiaComorosCongo, Dem. Rep.Congo, Rep.Costa RicaCote d'IvoireCroatiaCubaCuracaoCyprusCzech RepublicDenmarkDjiboutiDominicaDominican RepublicEarly-demographic dividendEast Asia & PacificEast Asia & Pacific (excluding high income)East Asia & Pacific (IDA & IBRD countries)EcuadorEgypt, Arab Rep.El SalvadorEquatorial GuineaEritreaEstoniaEthiopiaEuro areaEurope & Central AsiaEurope & Central Asia (excluding high income)Europe & Central Asia (IDA & IBRD countries)European UnionFaroe IslandsFijiFinlandFragile and conflict affected situationsFranceFrench PolynesiaGabonGambia, TheGeorgiaGermanyGhanaGibraltarGreeceGreenlandGrenadaGuamGuatemalaGuineaGuinea-BissauGuyanaHaitiHeavily indebted poor countries (HIPC)High incomeHondurasHong Kong SAR, ChinaHungaryIBRD onlyIcelandIDA & IBRD totalIDA blendIDA onlyIDA totalIndiaIndonesiaIran, Islamic Rep.IraqIrelandIsle of ManIsraelItalyJamaicaJapanJordanKazakhstanKenyaKiribatiKorea, Dem. People’s Rep.Korea, Rep.KosovoKuwaitKyrgyz RepublicLao PDRLate-demographic dividendLatin America & Caribbean Latin America & Caribbean (excluding high income)Latin America & the Caribbean (IDA & IBRD countries)LatviaLeast developed countries: UN classificationLebanonLesothoLiberiaLibyaLiechtensteinLithuaniaLow & middle incomeLow incomeLower middle incomeLuxembourgMacao SAR, ChinaMacedonia, FYRMadagascarMalawiMalaysiaMaldivesMaliMaltaMarshall IslandsMauritaniaMauritiusMexicoMicronesia, Fed. Sts.Middle East & North AfricaMiddle East & North Africa (excluding high income)Middle East & North Africa (IDA & IBRD countries)Middle incomeMoldovaMonacoMongoliaMontenegroMoroccoMozambiqueMyanmarNamibiaNauruNepalNetherlandsNew CaledoniaNew ZealandNicaraguaNigerNigeriaNorth AmericaNorthern Mariana IslandsNorwayOECD membersOmanOther small statesPacific island small statesPakistanPalauPanamaPapua New GuineaParaguayPeruPhilippinesPolandPortugalPost-demographic dividendPre-demographic dividendPuerto RicoQatarRomaniaRussian FederationRwandaSamoaSan MarinoSao Tome and PrincipeSaudi ArabiaSenegalSerbiaSeychellesSierra LeoneSingaporeSint Maarten (Dutch part)Slovak RepublicSloveniaSmall statesSolomon IslandsSomaliaSouth AfricaSouth AsiaSouth Asia (IDA & IBRD)South SudanSpainSri LankaSt. Kitts and NevisSt. LuciaSt. Martin (French part)St. Vincent and the GrenadinesSub-Saharan Africa Sub-Saharan Africa (excluding high income)Sub-Saharan Africa (IDA & IBRD countries)SudanSurinameSwazilandSwedenSwitzerlandSyrian Arab RepublicTajikistanTanzaniaThailandTimor-LesteTogoTongaTrinidad and TobagoTunisiaTurkeyTurkmenistanTurks and Caicos IslandsTuvaluUgandaUkraineUnited Arab EmiratesUnited KingdomUnited StatesUpper middle incomeUruguayUzbekistanVanuatuVenezuela, RBVietnamVirgin Islands (U.S.)West Bank and GazaWorldYemen, Rep.ZambiaZimbabwe Timeline:
This timeline shows a graph from 1962 to 2016 of Sub-Saharan Africa . No data until 1961. Number of actual observations by date: 55.
Source name:
World Development Indicators
Source organization:
Derived from total population. Population source: (1) United Nations Population Division. World Population Prospects, (2) United Nations Statistical Division. Population and Vital Statistics Report (various years), (3) Census reports and other statistical
Categories, topics:
Climate Change, Health
Last updated:
apr 23, 2017
Indicators value changes by year
At the date of observation
Value
Absolute change
Change from previous value
jan 1, 1962
2.406
+2.406
0.0%
jan 1, 1963
2.414
+0.009
0.36%
jan 1, 1964
2.428
+0.014
0.58%
jan 1, 1965
2.446
+0.018
0.74%
jan 1, 1966
2.468
+0.021
0.87%
jan 1, 1967
2.492
+0.025
1.0%
jan 1, 1968
2.519
+0.027
1.08%
jan 1, 1969
2.547
+0.027
1.08%
jan 1, 1970
2.573
+0.027
1.04%
jan 1, 1971
2.599
+0.026
1.02%
jan 1, 1972
2.631
+0.032
1.23%
jan 1, 1973
2.652
+0.021
0.79%
jan 1, 1974
2.678
+0.026
0.97%
jan 1, 1975
2.71
+0.032
1.21%
jan 1, 1976
2.746
+0.036
1.32%
jan 1, 1977
2.781
+0.035
1.28%
jan 1, 1978
2.809
+0.028
1.0%
jan 1, 1979
2.831
+0.022
0.77%
jan 1, 1980
2.849
+0.018
0.64%
jan 1, 1981
2.861
+0.012
0.42%
jan 1, 1982
2.866
+0.005
0.18%
jan 1, 1983
2.87
+0.004
0.14%
jan 1, 1984
2.875
+0.005
0.18%
jan 1, 1985
2.884
+0.009
0.31%
jan 1, 1986
2.892
+0.008
0.27%
jan 1, 1987
2.896
+0.004
0.15%
jan 1, 1988
2.893
-0.003
-0.1%
jan 1, 1989
2.883
-0.01
-0.36%
jan 1, 1990
2.864
-0.019
-0.65%
jan 1, 1991
2.838
-0.026
-0.91%
jan 1, 1992
2.83
-0.008
-0.29%
jan 1, 1993
2.821
-0.009
-0.32%
jan 1, 1994
2.805
-0.016
-0.56%
jan 1, 1995
2.783
-0.022
-0.78%
jan 1, 1996
2.757
-0.026
-0.95%
jan 1, 1997
2.734
-0.022
-0.81%
jan 1, 1998
2.718
-0.017
-0.61%
jan 1, 1999
2.71
-0.008
-0.3%
jan 1, 2000
2.714
+0.004
0.15%
jan 1, 2001
2.725
+0.011
0.41%
jan 1, 2002
2.704
-0.021
-0.78%
jan 1, 2003
2.655
-0.048
-1.79%
jan 1, 2004
2.674
+0.019
0.73%
jan 1, 2005
2.695
+0.02
0.75%
jan 1, 2006
2.717
+0.022
0.83%
jan 1, 2007
2.739
+0.022
0.8%
jan 1, 2008
2.756
+0.018
0.65%
jan 1, 2009
2.769
+0.013
0.46%
jan 1, 2010
2.774
+0.005
0.19%
jan 1, 2011
2.775
+0.0
0.01%
jan 1, 2012
2.772
-0.003
-0.11%
jan 1, 2013
2.768
-0.004
-0.13%
jan 1, 2014
2.76
-0.008
-0.3%
jan 1, 2015
2.747
-0.013
-0.46%
jan 1, 2016
2.731
-0.016
-0.58%
Ranking of countries by current statistics by years


Comments: