29
/
en
AIzaSyAYiBZKx7MnpbEhh9jyipgxe19OcubqV5w
April 1, 2024
242015
Slovak Republic
SVK
true
2
1
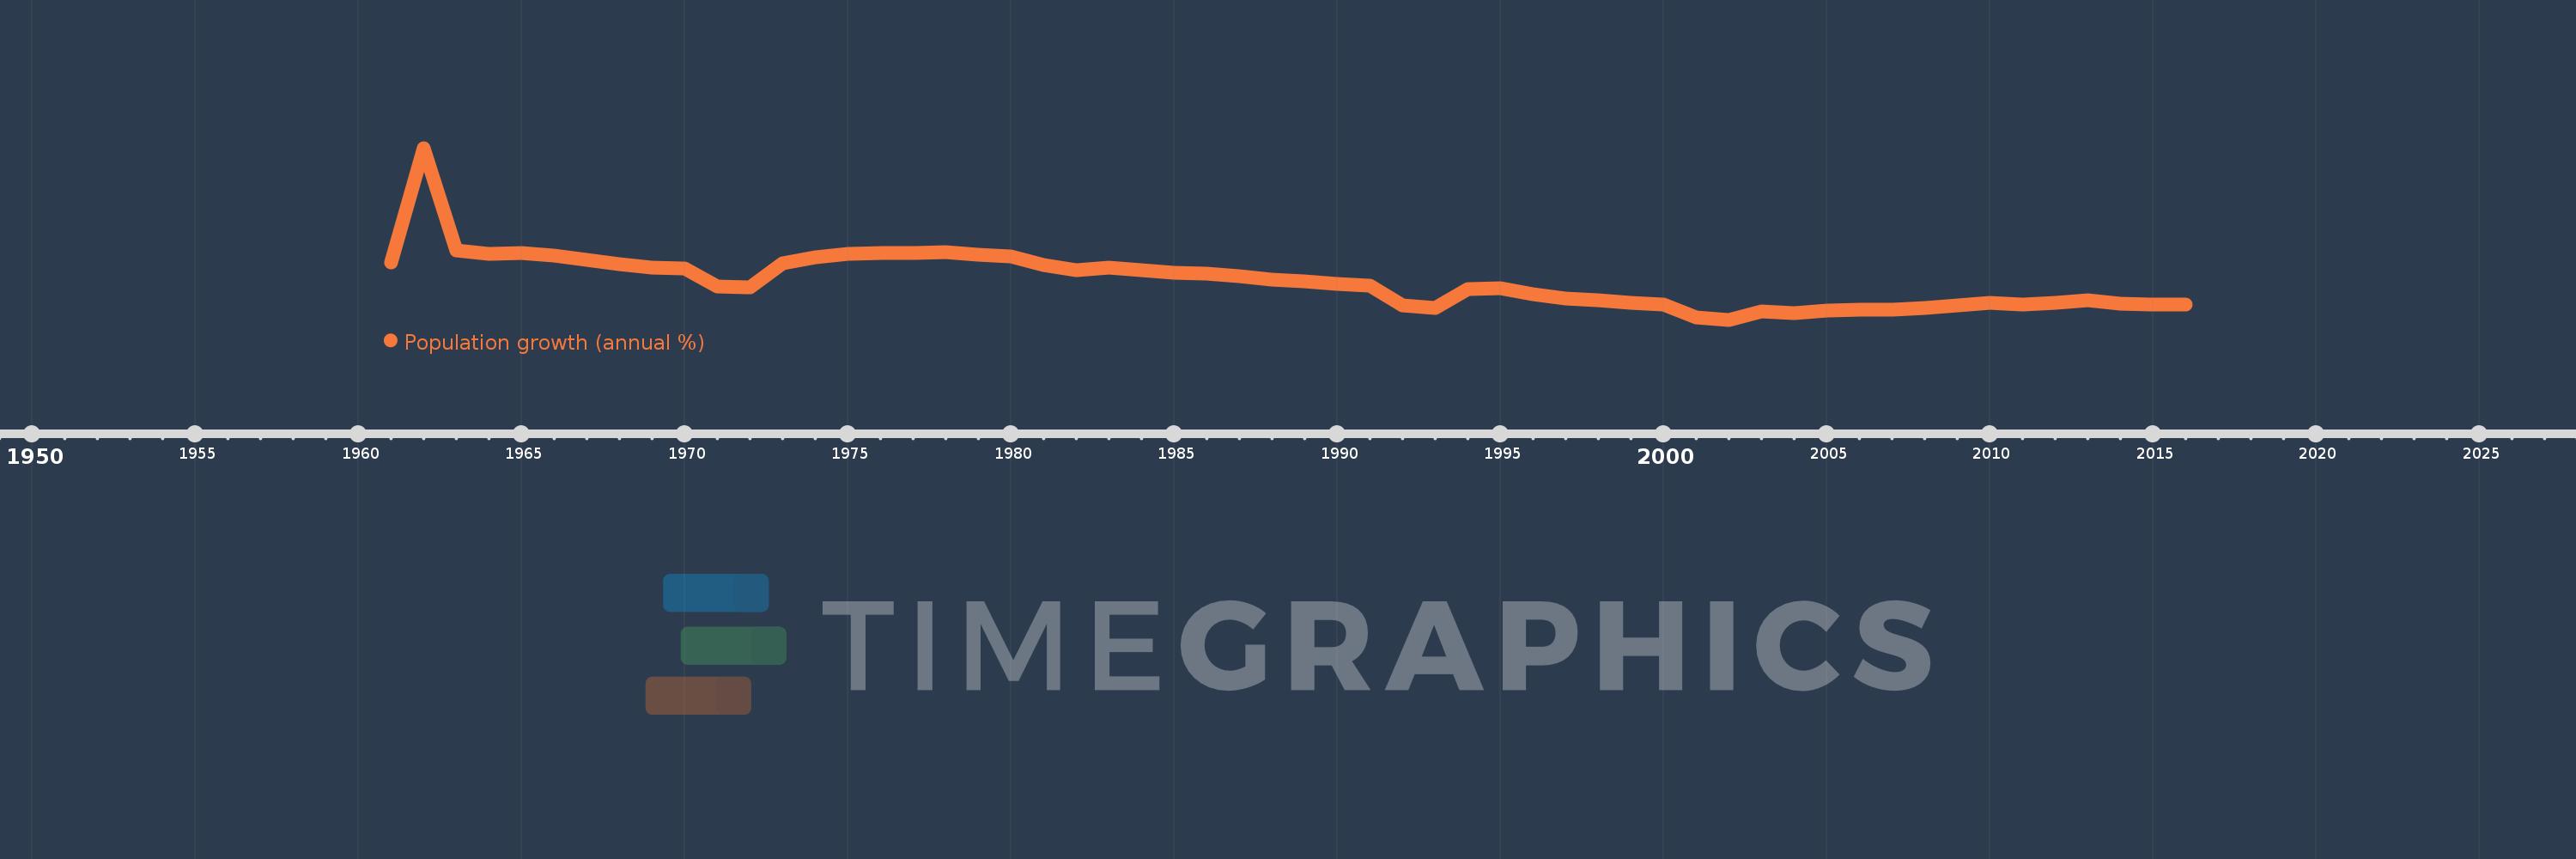
Population growth (annual %)
2016,2015,2014,2013,2012,2011,2010,2009,2008,2007,2006,2005,2004,2003,2002,2001,2000,1999,1998,1997,1996,1995,1994,1993,1992,1991,1990,1989,1988,1987,1986,1985,1984,1983,1982,1981,1980,1979,1978,1977,1976,1975,1974,1973,1972,1971,1970,1969,1968,1967,1966,1965,1964,1963,1962,1961
This statistics in other country:
AfghanistanAlbaniaAlgeriaAmerican SamoaAndorraAngolaAntigua and BarbudaArab WorldArgentinaArmeniaArubaAustraliaAustriaAzerbaijanBahamas, TheBahrainBangladeshBarbadosBelarusBelgiumBelizeBeninBermudaBhutanBoliviaBosnia and HerzegovinaBotswanaBrazilBritish Virgin IslandsBrunei DarussalamBulgariaBurkina FasoBurundiCabo VerdeCambodiaCameroonCanadaCaribbean small statesCayman IslandsCentral African RepublicCentral Europe and the BalticsChadChannel IslandsChileChinaColombiaComorosCongo, Dem. Rep.Congo, Rep.Costa RicaCote d'IvoireCroatiaCubaCuracaoCyprusCzech RepublicDenmarkDjiboutiDominicaDominican RepublicEarly-demographic dividendEast Asia & PacificEast Asia & Pacific (excluding high income)East Asia & Pacific (IDA & IBRD countries)EcuadorEgypt, Arab Rep.El SalvadorEquatorial GuineaEritreaEstoniaEthiopiaEuro areaEurope & Central AsiaEurope & Central Asia (excluding high income)Europe & Central Asia (IDA & IBRD countries)European UnionFaroe IslandsFijiFinlandFragile and conflict affected situationsFranceFrench PolynesiaGabonGambia, TheGeorgiaGermanyGhanaGibraltarGreeceGreenlandGrenadaGuamGuatemalaGuineaGuinea-BissauGuyanaHaitiHeavily indebted poor countries (HIPC)High incomeHondurasHong Kong SAR, ChinaHungaryIBRD onlyIcelandIDA & IBRD totalIDA blendIDA onlyIDA totalIndiaIndonesiaIran, Islamic Rep.IraqIrelandIsle of ManIsraelItalyJamaicaJapanJordanKazakhstanKenyaKiribatiKorea, Dem. People’s Rep.Korea, Rep.KosovoKuwaitKyrgyz RepublicLao PDRLate-demographic dividendLatin America & Caribbean Latin America & Caribbean (excluding high income)Latin America & the Caribbean (IDA & IBRD countries)LatviaLeast developed countries: UN classificationLebanonLesothoLiberiaLibyaLiechtensteinLithuaniaLow & middle incomeLow incomeLower middle incomeLuxembourgMacao SAR, ChinaMacedonia, FYRMadagascarMalawiMalaysiaMaldivesMaliMaltaMarshall IslandsMauritaniaMauritiusMexicoMicronesia, Fed. Sts.Middle East & North AfricaMiddle East & North Africa (excluding high income)Middle East & North Africa (IDA & IBRD countries)Middle incomeMoldovaMonacoMongoliaMontenegroMoroccoMozambiqueMyanmarNamibiaNauruNepalNetherlandsNew CaledoniaNew ZealandNicaraguaNigerNigeriaNorth AmericaNorthern Mariana IslandsNorwayOECD membersOmanOther small statesPacific island small statesPakistanPalauPanamaPapua New GuineaParaguayPeruPhilippinesPolandPortugalPost-demographic dividendPre-demographic dividendPuerto RicoQatarRomaniaRussian FederationRwandaSamoaSan MarinoSao Tome and PrincipeSaudi ArabiaSenegalSerbiaSeychellesSierra LeoneSingaporeSint Maarten (Dutch part)Slovak RepublicSloveniaSmall statesSolomon IslandsSomaliaSouth AfricaSouth AsiaSouth Asia (IDA & IBRD)South SudanSpainSri LankaSt. Kitts and NevisSt. LuciaSt. Martin (French part)St. Vincent and the GrenadinesSub-Saharan Africa Sub-Saharan Africa (excluding high income)Sub-Saharan Africa (IDA & IBRD countries)SudanSurinameSwazilandSwedenSwitzerlandSyrian Arab RepublicTajikistanTanzaniaThailandTimor-LesteTogoTongaTrinidad and TobagoTunisiaTurkeyTurkmenistanTurks and Caicos IslandsTuvaluUgandaUkraineUnited Arab EmiratesUnited KingdomUnited StatesUpper middle incomeUruguayUzbekistanVanuatuVenezuela, RBVietnamVirgin Islands (U.S.)West Bank and GazaWorldYemen, Rep.ZambiaZimbabwe Timeline:
This timeline shows a graph from 1961 to 2016 of Slovak Republic. No data until 1960. Number of actual observations by date: 56.
Source name:
World Development Indicators
Source organization:
Derived from total population. Population source: (1) United Nations Population Division. World Population Prospects, (2) United Nations Statistical Division. Population and Vital Statistics Report (various years), (3) Census reports and other statistical
Categories, topics:
Climate Change, Health
Last updated:
apr 23, 2017
Indicators value changes by year
Minimum:
-0.183
jan 1, 2002
At the date of observation
Value
Absolute change
Change from previous value
jan 1, 1961
0.871
+0.871
0.0%
jan 1, 1962
2.992
+2.121
243.39%
jan 1, 1963
1.104
-1.889
-63.12%
jan 1, 1964
1.029
-0.075
-6.79%
jan 1, 1965
1.053
+0.024
2.34%
jan 1, 1966
1.003
-0.049
-4.7%
jan 1, 1967
0.926
-0.077
-7.68%
jan 1, 1968
0.851
-0.076
-8.15%
jan 1, 1969
0.773
-0.077
-9.1%
jan 1, 1970
0.771
-0.003
-0.36%
jan 1, 1971
0.433
-0.338
-43.8%
jan 1, 1972
0.423
-0.01
-2.41%
jan 1, 1973
0.856
+0.433
102.45%
jan 1, 1974
0.97
+0.115
13.38%
jan 1, 1975
1.033
+0.062
6.41%
jan 1, 1976
1.05
+0.017
1.64%
jan 1, 1977
1.058
+0.008
0.79%
jan 1, 1978
1.059
+0.001
0.11%
jan 1, 1979
1.02
-0.039
-3.69%
jan 1, 1980
0.994
-0.026
-2.55%
jan 1, 1981
0.824
-0.17
-17.15%
jan 1, 1982
0.726
-0.097
-11.83%
jan 1, 1983
0.774
+0.048
6.65%
jan 1, 1984
0.727
-0.048
-6.15%
jan 1, 1985
0.687
-0.039
-5.41%
jan 1, 1986
0.674
-0.014
-1.96%
jan 1, 1987
0.619
-0.055
-8.1%
jan 1, 1988
0.557
-0.063
-10.1%
jan 1, 1989
0.53
-0.027
-4.81%
jan 1, 1990
0.482
-0.048
-9.14%
jan 1, 1991
0.44
-0.042
-8.71%
jan 1, 1992
0.077
-0.362
-82.38%
jan 1, 1993
0.032
-0.045
-58.09%
jan 1, 1994
0.382
+0.349
1.08K%
jan 1, 1995
0.394
+0.012
3.23%
jan 1, 1996
0.293
-0.101
-25.74%
jan 1, 1997
0.212
-0.081
-27.67%
jan 1, 1998
0.185
-0.027
-12.78%
jan 1, 1999
0.134
-0.051
-27.36%
jan 1, 2000
0.102
-0.032
-23.91%
jan 1, 2001
-0.135
-0.237
-232.65%
jan 1, 2002
-0.183
-0.048
35.19%
jan 1, 2003
-0.036
+0.147
-80.14%
jan 1, 2004
-0.066
-0.029
81.06%
jan 1, 2005
-0.02
+0.045
-69.07%
jan 1, 2006
0.01
+0.03
-148.17%
jan 1, 2007
0.005
-0.005
-53.13%
jan 1, 2008
0.029
+0.025
534.71%
jan 1, 2009
0.086
+0.057
193.9%
jan 1, 2010
0.133
+0.048
55.39%
jan 1, 2011
0.093
-0.04
-30.07%
jan 1, 2012
0.129
+0.036
38.36%
jan 1, 2013
0.17
+0.041
31.99%
jan 1, 2014
0.107
-0.063
-36.86%
jan 1, 2015
0.097
-0.01
-9.69%
jan 1, 2016
0.1
+0.003
2.66%
Ranking of countries by current statistics by years


Comments: