29
/
en
AIzaSyAYiBZKx7MnpbEhh9jyipgxe19OcubqV5w
April 1, 2024
244907
Somalia
SOM
true
2
1
Population growth (annual %)
2016,2015,2014,2013,2012,2011,2010,2009,2008,2007,2006,2005,2004,2003,2002,2001,2000,1999,1998,1997,1996,1995,1994,1993,1992,1991,1990,1989,1988,1987,1986,1985,1984,1983,1982,1981,1980,1979,1978,1977,1976,1975,1974,1973,1972,1971,1970,1969,1968,1967,1966,1965,1964,1963,1962,1961
This statistics in other country:
AfghanistanAlbaniaAlgeriaAmerican SamoaAndorraAngolaAntigua and BarbudaArab WorldArgentinaArmeniaArubaAustraliaAustriaAzerbaijanBahamas, TheBahrainBangladeshBarbadosBelarusBelgiumBelizeBeninBermudaBhutanBoliviaBosnia and HerzegovinaBotswanaBrazilBritish Virgin IslandsBrunei DarussalamBulgariaBurkina FasoBurundiCabo VerdeCambodiaCameroonCanadaCaribbean small statesCayman IslandsCentral African RepublicCentral Europe and the BalticsChadChannel IslandsChileChinaColombiaComorosCongo, Dem. Rep.Congo, Rep.Costa RicaCote d'IvoireCroatiaCubaCuracaoCyprusCzech RepublicDenmarkDjiboutiDominicaDominican RepublicEarly-demographic dividendEast Asia & PacificEast Asia & Pacific (excluding high income)East Asia & Pacific (IDA & IBRD countries)EcuadorEgypt, Arab Rep.El SalvadorEquatorial GuineaEritreaEstoniaEthiopiaEuro areaEurope & Central AsiaEurope & Central Asia (excluding high income)Europe & Central Asia (IDA & IBRD countries)European UnionFaroe IslandsFijiFinlandFragile and conflict affected situationsFranceFrench PolynesiaGabonGambia, TheGeorgiaGermanyGhanaGibraltarGreeceGreenlandGrenadaGuamGuatemalaGuineaGuinea-BissauGuyanaHaitiHeavily indebted poor countries (HIPC)High incomeHondurasHong Kong SAR, ChinaHungaryIBRD onlyIcelandIDA & IBRD totalIDA blendIDA onlyIDA totalIndiaIndonesiaIran, Islamic Rep.IraqIrelandIsle of ManIsraelItalyJamaicaJapanJordanKazakhstanKenyaKiribatiKorea, Dem. People’s Rep.Korea, Rep.KosovoKuwaitKyrgyz RepublicLao PDRLate-demographic dividendLatin America & Caribbean Latin America & Caribbean (excluding high income)Latin America & the Caribbean (IDA & IBRD countries)LatviaLeast developed countries: UN classificationLebanonLesothoLiberiaLibyaLiechtensteinLithuaniaLow & middle incomeLow incomeLower middle incomeLuxembourgMacao SAR, ChinaMacedonia, FYRMadagascarMalawiMalaysiaMaldivesMaliMaltaMarshall IslandsMauritaniaMauritiusMexicoMicronesia, Fed. Sts.Middle East & North AfricaMiddle East & North Africa (excluding high income)Middle East & North Africa (IDA & IBRD countries)Middle incomeMoldovaMonacoMongoliaMontenegroMoroccoMozambiqueMyanmarNamibiaNauruNepalNetherlandsNew CaledoniaNew ZealandNicaraguaNigerNigeriaNorth AmericaNorthern Mariana IslandsNorwayOECD membersOmanOther small statesPacific island small statesPakistanPalauPanamaPapua New GuineaParaguayPeruPhilippinesPolandPortugalPost-demographic dividendPre-demographic dividendPuerto RicoQatarRomaniaRussian FederationRwandaSamoaSan MarinoSao Tome and PrincipeSaudi ArabiaSenegalSerbiaSeychellesSierra LeoneSingaporeSint Maarten (Dutch part)Slovak RepublicSloveniaSmall statesSolomon IslandsSomaliaSouth AfricaSouth AsiaSouth Asia (IDA & IBRD)South SudanSpainSri LankaSt. Kitts and NevisSt. LuciaSt. Martin (French part)St. Vincent and the GrenadinesSub-Saharan Africa Sub-Saharan Africa (excluding high income)Sub-Saharan Africa (IDA & IBRD countries)SudanSurinameSwazilandSwedenSwitzerlandSyrian Arab RepublicTajikistanTanzaniaThailandTimor-LesteTogoTongaTrinidad and TobagoTunisiaTurkeyTurkmenistanTurks and Caicos IslandsTuvaluUgandaUkraineUnited Arab EmiratesUnited KingdomUnited StatesUpper middle incomeUruguayUzbekistanVanuatuVenezuela, RBVietnamVirgin Islands (U.S.)West Bank and GazaWorldYemen, Rep.ZambiaZimbabwe Timeline:
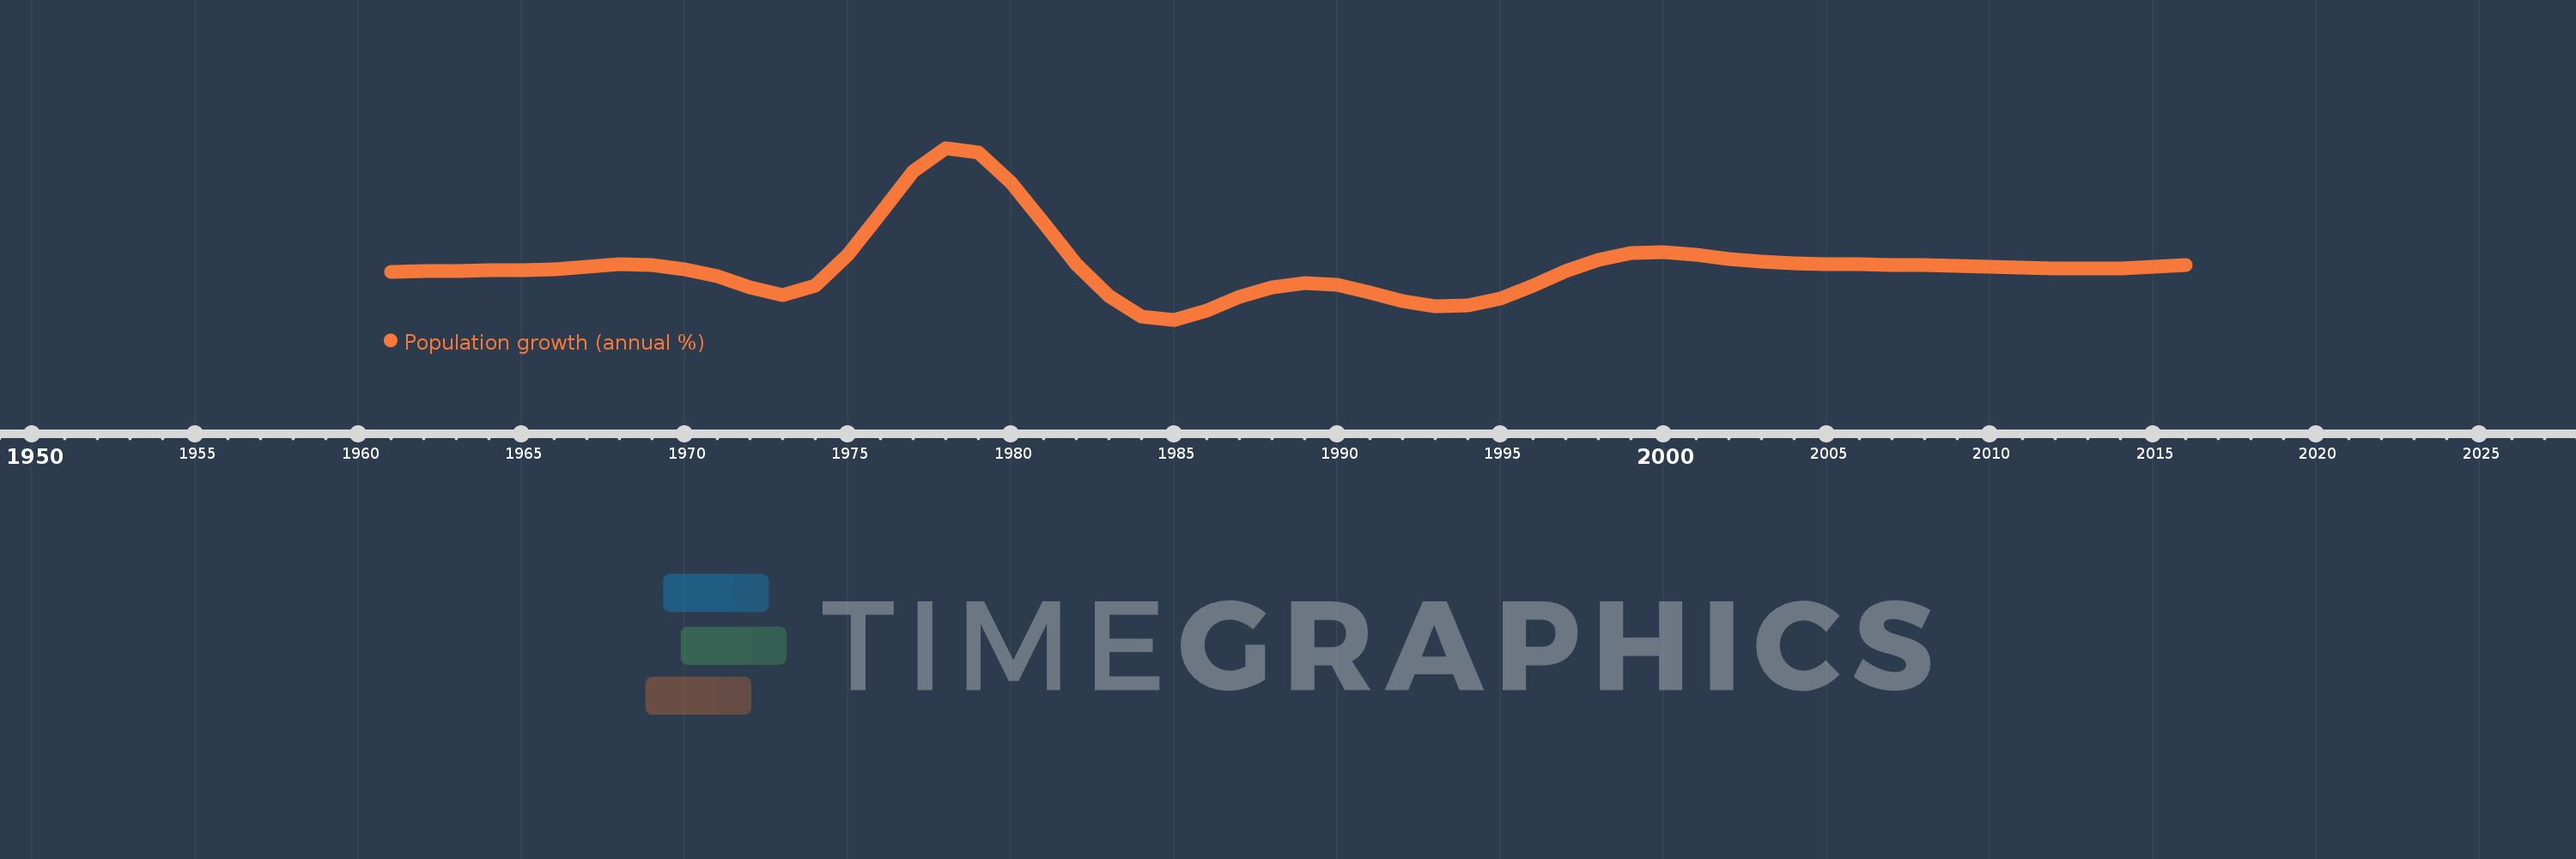
This timeline shows a graph from 1961 to 2016 of Somalia. No data until 1960. Number of actual observations by date: 56.
Source name:
World Development Indicators
Source organization:
Derived from total population. Population source: (1) United Nations Population Division. World Population Prospects, (2) United Nations Statistical Division. Population and Vital Statistics Report (various years), (3) Census reports and other statistical
Categories, topics:
Climate Change, Health
Last updated:
apr 23, 2017
Indicators value changes by year
Minimum:
-1.404
jan 1, 1985
Maximum:
10.983
jan 1, 1978
At the date of observation
Value
Absolute change
Change from previous value
jan 1, 1961
2.07
+2.07
0.0%
jan 1, 1962
2.093
+0.023
1.12%
jan 1, 1963
2.118
+0.025
1.2%
jan 1, 1964
2.148
+0.029
1.39%
jan 1, 1965
2.183
+0.035
1.62%
jan 1, 1966
2.22
+0.037
1.7%
jan 1, 1967
2.404
+0.184
8.3%
jan 1, 1968
2.606
+0.202
8.38%
jan 1, 1969
2.565
-0.04
-1.54%
jan 1, 1970
2.219
-0.346
-13.5%
jan 1, 1971
1.757
-0.462
-20.83%
jan 1, 1972
0.929
-0.828
-47.14%
jan 1, 1973
0.365
-0.563
-60.67%
jan 1, 1974
1.033
+0.667
182.7%
jan 1, 1975
3.293
+2.26
218.82%
jan 1, 1976
6.284
+2.992
90.86%
jan 1, 1977
9.31
+3.026
48.15%
jan 1, 1978
10.983
+1.673
17.97%
jan 1, 1979
10.662
-0.321
-2.93%
jan 1, 1980
8.512
-2.15
-20.17%
jan 1, 1981
5.584
-2.928
-34.39%
jan 1, 1982
2.626
-2.958
-52.98%
jan 1, 1983
0.316
-2.309
-87.95%
jan 1, 1984
-1.153
-1.469
-464.34%
jan 1, 1985
-1.404
-0.251
21.79%
jan 1, 1986
-0.736
+0.668
-47.57%
jan 1, 1987
0.235
+0.971
-131.98%
jan 1, 1988
0.919
+0.684
290.69%
jan 1, 1989
1.269
+0.35
38.06%
jan 1, 1990
1.09
-0.18
-14.15%
jan 1, 1991
0.574
-0.516
-47.36%
jan 1, 1992
-0.033
-0.607
-105.75%
jan 1, 1993
-0.405
-0.372
1.13K%
jan 1, 1994
-0.394
+0.01
-2.52%
jan 1, 1995
0.154
+0.548
-139.07%
jan 1, 1996
1.07
+0.916
594.29%
jan 1, 1997
2.096
+1.027
95.97%
jan 1, 1998
2.918
+0.822
39.19%
jan 1, 1999
3.41
+0.492
16.86%
jan 1, 2000
3.475
+0.066
1.93%
jan 1, 2001
3.262
-0.214
-6.15%
jan 1, 2002
2.996
-0.265
-8.14%
jan 1, 2003
2.814
-0.183
-6.1%
jan 1, 2004
2.671
-0.142
-5.06%
jan 1, 2005
2.602
-0.069
-2.58%
jan 1, 2006
2.583
-0.02
-0.75%
jan 1, 2007
2.565
-0.018
-0.68%
jan 1, 2008
2.524
-0.041
-1.59%
jan 1, 2009
2.479
-0.046
-1.81%
jan 1, 2010
2.426
-0.053
-2.13%
jan 1, 2011
2.375
-0.051
-2.09%
jan 1, 2012
2.321
-0.054
-2.29%
jan 1, 2013
2.288
-0.033
-1.41%
jan 1, 2014
2.311
+0.023
0.99%
jan 1, 2015
2.4
+0.089
3.87%
jan 1, 2016
2.53
+0.13
5.44%
Ranking of countries by current statistics by years


Comments: