29
/
en
AIzaSyAYiBZKx7MnpbEhh9jyipgxe19OcubqV5w
April 1, 2024
120289
Djibouti
DJI
true
2
1
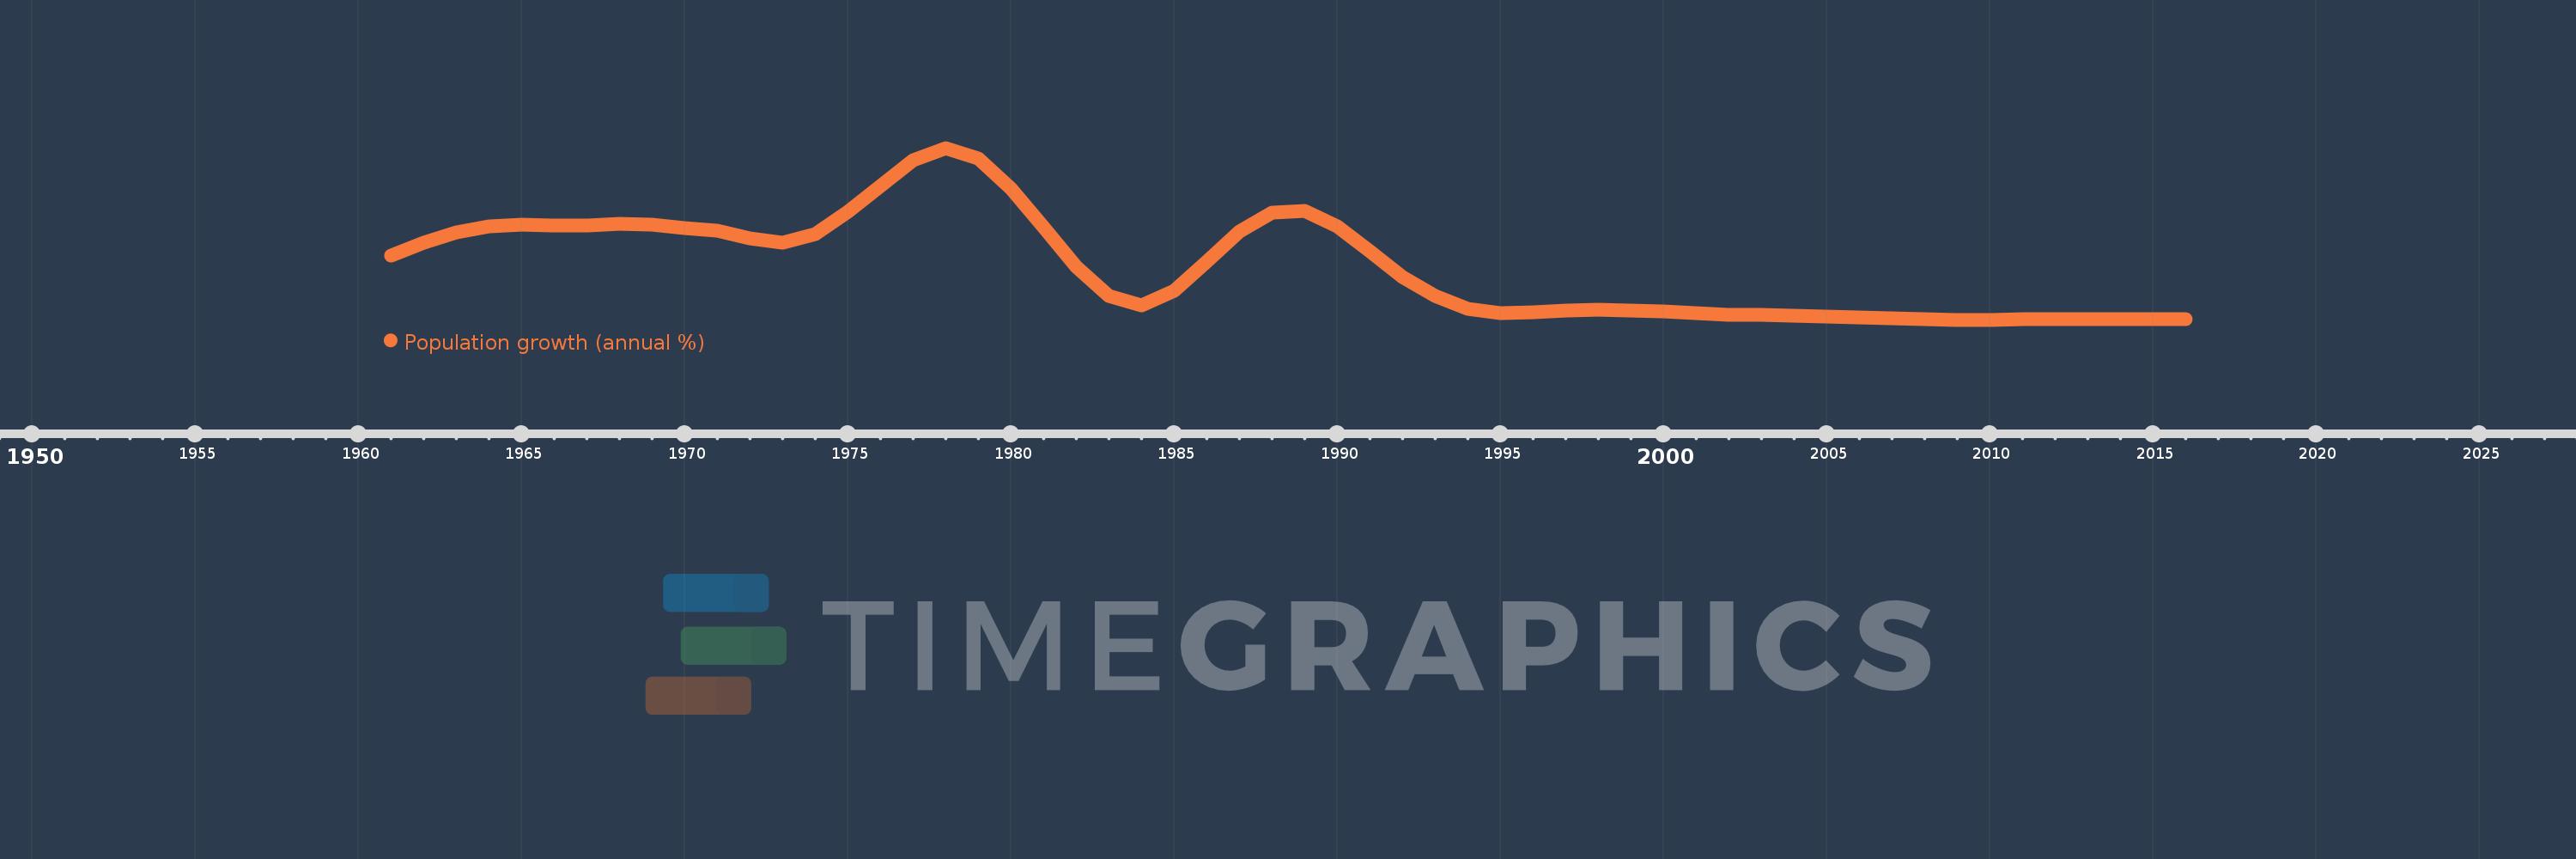
Population growth (annual %)
2016,2015,2014,2013,2012,2011,2010,2009,2008,2007,2006,2005,2004,2003,2002,2001,2000,1999,1998,1997,1996,1995,1994,1993,1992,1991,1990,1989,1988,1987,1986,1985,1984,1983,1982,1981,1980,1979,1978,1977,1976,1975,1974,1973,1972,1971,1970,1969,1968,1967,1966,1965,1964,1963,1962,1961
This statistics in other country:
AfghanistanAlbaniaAlgeriaAmerican SamoaAndorraAngolaAntigua and BarbudaArab WorldArgentinaArmeniaArubaAustraliaAustriaAzerbaijanBahamas, TheBahrainBangladeshBarbadosBelarusBelgiumBelizeBeninBermudaBhutanBoliviaBosnia and HerzegovinaBotswanaBrazilBritish Virgin IslandsBrunei DarussalamBulgariaBurkina FasoBurundiCabo VerdeCambodiaCameroonCanadaCaribbean small statesCayman IslandsCentral African RepublicCentral Europe and the BalticsChadChannel IslandsChileChinaColombiaComorosCongo, Dem. Rep.Congo, Rep.Costa RicaCote d'IvoireCroatiaCubaCuracaoCyprusCzech RepublicDenmarkDjiboutiDominicaDominican RepublicEarly-demographic dividendEast Asia & PacificEast Asia & Pacific (excluding high income)East Asia & Pacific (IDA & IBRD countries)EcuadorEgypt, Arab Rep.El SalvadorEquatorial GuineaEritreaEstoniaEthiopiaEuro areaEurope & Central AsiaEurope & Central Asia (excluding high income)Europe & Central Asia (IDA & IBRD countries)European UnionFaroe IslandsFijiFinlandFragile and conflict affected situationsFranceFrench PolynesiaGabonGambia, TheGeorgiaGermanyGhanaGibraltarGreeceGreenlandGrenadaGuamGuatemalaGuineaGuinea-BissauGuyanaHaitiHeavily indebted poor countries (HIPC)High incomeHondurasHong Kong SAR, ChinaHungaryIBRD onlyIcelandIDA & IBRD totalIDA blendIDA onlyIDA totalIndiaIndonesiaIran, Islamic Rep.IraqIrelandIsle of ManIsraelItalyJamaicaJapanJordanKazakhstanKenyaKiribatiKorea, Dem. People’s Rep.Korea, Rep.KosovoKuwaitKyrgyz RepublicLao PDRLate-demographic dividendLatin America & Caribbean Latin America & Caribbean (excluding high income)Latin America & the Caribbean (IDA & IBRD countries)LatviaLeast developed countries: UN classificationLebanonLesothoLiberiaLibyaLiechtensteinLithuaniaLow & middle incomeLow incomeLower middle incomeLuxembourgMacao SAR, ChinaMacedonia, FYRMadagascarMalawiMalaysiaMaldivesMaliMaltaMarshall IslandsMauritaniaMauritiusMexicoMicronesia, Fed. Sts.Middle East & North AfricaMiddle East & North Africa (excluding high income)Middle East & North Africa (IDA & IBRD countries)Middle incomeMoldovaMonacoMongoliaMontenegroMoroccoMozambiqueMyanmarNamibiaNauruNepalNetherlandsNew CaledoniaNew ZealandNicaraguaNigerNigeriaNorth AmericaNorthern Mariana IslandsNorwayOECD membersOmanOther small statesPacific island small statesPakistanPalauPanamaPapua New GuineaParaguayPeruPhilippinesPolandPortugalPost-demographic dividendPre-demographic dividendPuerto RicoQatarRomaniaRussian FederationRwandaSamoaSan MarinoSao Tome and PrincipeSaudi ArabiaSenegalSerbiaSeychellesSierra LeoneSingaporeSint Maarten (Dutch part)Slovak RepublicSloveniaSmall statesSolomon IslandsSomaliaSouth AfricaSouth AsiaSouth Asia (IDA & IBRD)South SudanSpainSri LankaSt. Kitts and NevisSt. LuciaSt. Martin (French part)St. Vincent and the GrenadinesSub-Saharan Africa Sub-Saharan Africa (excluding high income)Sub-Saharan Africa (IDA & IBRD countries)SudanSurinameSwazilandSwedenSwitzerlandSyrian Arab RepublicTajikistanTanzaniaThailandTimor-LesteTogoTongaTrinidad and TobagoTunisiaTurkeyTurkmenistanTurks and Caicos IslandsTuvaluUgandaUkraineUnited Arab EmiratesUnited KingdomUnited StatesUpper middle incomeUruguayUzbekistanVanuatuVenezuela, RBVietnamVirgin Islands (U.S.)West Bank and GazaWorldYemen, Rep.ZambiaZimbabwe Timeline:
This timeline shows a graph from 1961 to 2016 of Djibouti. No data until 1960. Number of actual observations by date: 56.
Source name:
World Development Indicators
Source organization:
Derived from total population. Population source: (1) United Nations Population Division. World Population Prospects, (2) United Nations Statistical Division. Population and Vital Statistics Report (various years), (3) Census reports and other statistical
Categories, topics:
Climate Change, Health
Last updated:
apr 23, 2017
Indicators value changes by year
Maximum:
11.034
jan 1, 1978
At the date of observation
Value
Absolute change
Change from previous value
jan 1, 1961
4.925
+4.925
0.0%
jan 1, 1962
5.652
+0.727
14.76%
jan 1, 1963
6.243
+0.591
10.46%
jan 1, 1964
6.595
+0.352
5.64%
jan 1, 1965
6.69
+0.095
1.44%
jan 1, 1966
6.634
-0.056
-0.84%
jan 1, 1967
6.65
+0.016
0.24%
jan 1, 1968
6.716
+0.066
0.99%
jan 1, 1969
6.666
-0.05
-0.74%
jan 1, 1970
6.498
-0.168
-2.52%
jan 1, 1971
6.318
-0.18
-2.76%
jan 1, 1972
5.9
-0.419
-6.63%
jan 1, 1973
5.648
-0.251
-4.26%
jan 1, 1974
6.127
+0.479
8.48%
jan 1, 1975
7.393
+1.266
20.67%
jan 1, 1976
8.868
+1.475
19.95%
jan 1, 1977
10.346
+1.478
16.67%
jan 1, 1978
11.034
+0.688
6.65%
jan 1, 1979
10.453
-0.581
-5.26%
jan 1, 1980
8.708
-1.745
-16.7%
jan 1, 1981
6.534
-2.173
-24.96%
jan 1, 1982
4.287
-2.247
-34.39%
jan 1, 1983
2.65
-1.637
-38.2%
jan 1, 1984
2.1
-0.55
-20.74%
jan 1, 1985
2.93
+0.83
39.51%
jan 1, 1986
4.561
+1.631
55.69%
jan 1, 1987
6.314
+1.752
38.42%
jan 1, 1988
7.37
+1.056
16.73%
jan 1, 1989
7.478
+0.108
1.47%
jan 1, 1990
6.572
-0.906
-12.11%
jan 1, 1991
5.152
-1.42
-21.6%
jan 1, 1992
3.724
-1.428
-27.72%
jan 1, 1993
2.648
-1.076
-28.9%
jan 1, 1994
1.919
-0.728
-27.5%
jan 1, 1995
1.654
-0.265
-13.81%
jan 1, 1996
1.708
+0.054
3.27%
jan 1, 1997
1.818
+0.109
6.39%
jan 1, 1998
1.831
+0.014
0.75%
jan 1, 1999
1.823
-0.009
-0.47%
jan 1, 2000
1.76
-0.063
-3.46%
jan 1, 2001
1.662
-0.098
-5.55%
jan 1, 2002
1.583
-0.079
-4.78%
jan 1, 2003
1.537
-0.045
-2.87%
jan 1, 2004
1.491
-0.046
-3.01%
jan 1, 2005
1.442
-0.049
-3.29%
jan 1, 2006
1.392
-0.05
-3.43%
jan 1, 2007
1.344
-0.048
-3.44%
jan 1, 2008
1.306
-0.039
-2.88%
jan 1, 2009
1.284
-0.022
-1.65%
jan 1, 2010
1.283
-0.001
-0.05%
jan 1, 2011
1.297
+0.013
1.05%
jan 1, 2012
1.315
+0.018
1.42%
jan 1, 2013
1.33
+0.014
1.08%
jan 1, 2014
1.337
+0.008
0.58%
jan 1, 2015
1.335
-0.002
-0.17%
jan 1, 2016
1.325
-0.01
-0.75%
Ranking of countries by current statistics by years


Comments: