29
/
en
AIzaSyAYiBZKx7MnpbEhh9jyipgxe19OcubqV5w
April 1, 2024
142632
Greenland
GRL
true
2
1
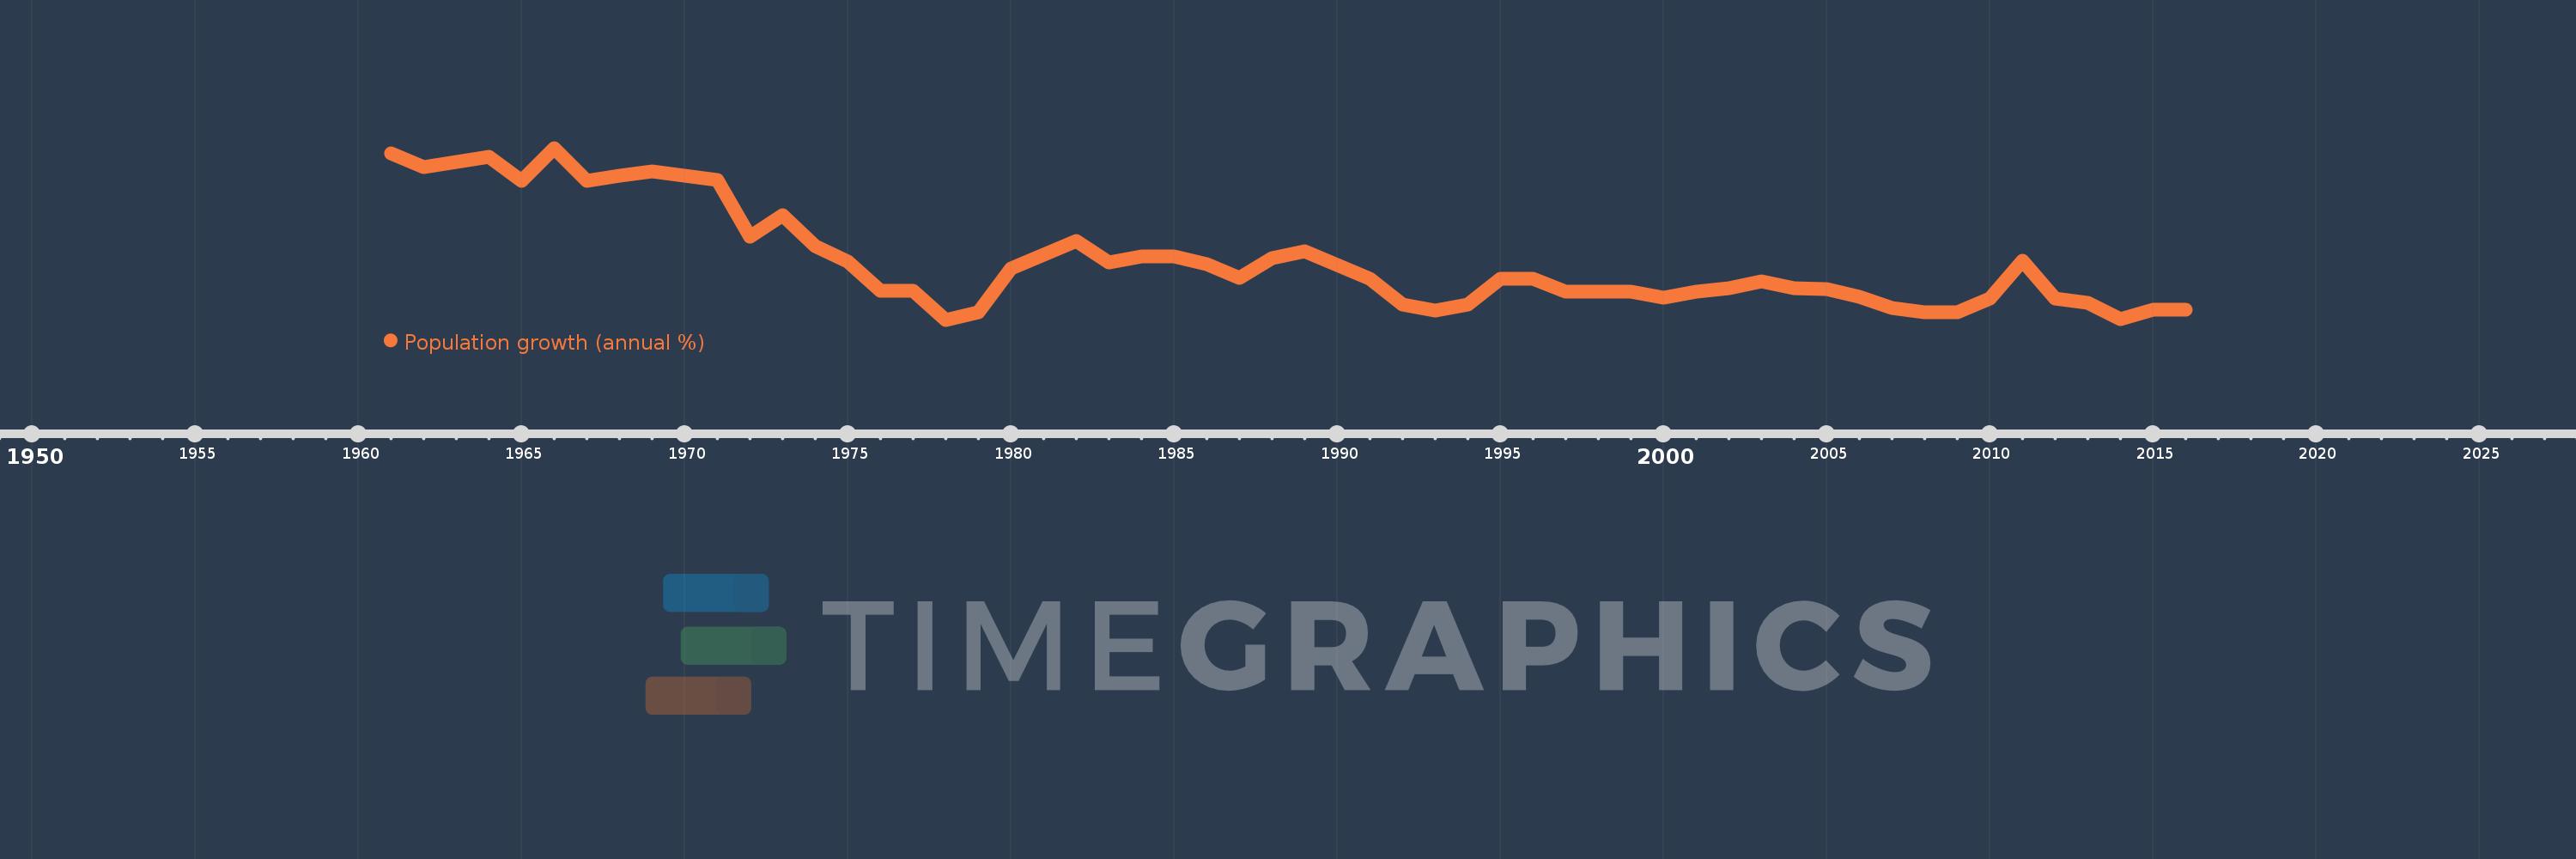
Population growth (annual %)
2016,2015,2014,2013,2012,2011,2010,2009,2008,2007,2006,2005,2004,2003,2002,2001,2000,1999,1998,1997,1996,1995,1994,1993,1992,1991,1990,1989,1988,1987,1986,1985,1984,1983,1982,1981,1980,1979,1978,1977,1976,1975,1974,1973,1972,1971,1970,1969,1968,1967,1966,1965,1964,1963,1962,1961
This statistics in other country:
AfghanistanAlbaniaAlgeriaAmerican SamoaAndorraAngolaAntigua and BarbudaArab WorldArgentinaArmeniaArubaAustraliaAustriaAzerbaijanBahamas, TheBahrainBangladeshBarbadosBelarusBelgiumBelizeBeninBermudaBhutanBoliviaBosnia and HerzegovinaBotswanaBrazilBritish Virgin IslandsBrunei DarussalamBulgariaBurkina FasoBurundiCabo VerdeCambodiaCameroonCanadaCaribbean small statesCayman IslandsCentral African RepublicCentral Europe and the BalticsChadChannel IslandsChileChinaColombiaComorosCongo, Dem. Rep.Congo, Rep.Costa RicaCote d'IvoireCroatiaCubaCuracaoCyprusCzech RepublicDenmarkDjiboutiDominicaDominican RepublicEarly-demographic dividendEast Asia & PacificEast Asia & Pacific (excluding high income)East Asia & Pacific (IDA & IBRD countries)EcuadorEgypt, Arab Rep.El SalvadorEquatorial GuineaEritreaEstoniaEthiopiaEuro areaEurope & Central AsiaEurope & Central Asia (excluding high income)Europe & Central Asia (IDA & IBRD countries)European UnionFaroe IslandsFijiFinlandFragile and conflict affected situationsFranceFrench PolynesiaGabonGambia, TheGeorgiaGermanyGhanaGibraltarGreeceGreenlandGrenadaGuamGuatemalaGuineaGuinea-BissauGuyanaHaitiHeavily indebted poor countries (HIPC)High incomeHondurasHong Kong SAR, ChinaHungaryIBRD onlyIcelandIDA & IBRD totalIDA blendIDA onlyIDA totalIndiaIndonesiaIran, Islamic Rep.IraqIrelandIsle of ManIsraelItalyJamaicaJapanJordanKazakhstanKenyaKiribatiKorea, Dem. People’s Rep.Korea, Rep.KosovoKuwaitKyrgyz RepublicLao PDRLate-demographic dividendLatin America & Caribbean Latin America & Caribbean (excluding high income)Latin America & the Caribbean (IDA & IBRD countries)LatviaLeast developed countries: UN classificationLebanonLesothoLiberiaLibyaLiechtensteinLithuaniaLow & middle incomeLow incomeLower middle incomeLuxembourgMacao SAR, ChinaMacedonia, FYRMadagascarMalawiMalaysiaMaldivesMaliMaltaMarshall IslandsMauritaniaMauritiusMexicoMicronesia, Fed. Sts.Middle East & North AfricaMiddle East & North Africa (excluding high income)Middle East & North Africa (IDA & IBRD countries)Middle incomeMoldovaMonacoMongoliaMontenegroMoroccoMozambiqueMyanmarNamibiaNauruNepalNetherlandsNew CaledoniaNew ZealandNicaraguaNigerNigeriaNorth AmericaNorthern Mariana IslandsNorwayOECD membersOmanOther small statesPacific island small statesPakistanPalauPanamaPapua New GuineaParaguayPeruPhilippinesPolandPortugalPost-demographic dividendPre-demographic dividendPuerto RicoQatarRomaniaRussian FederationRwandaSamoaSan MarinoSao Tome and PrincipeSaudi ArabiaSenegalSerbiaSeychellesSierra LeoneSingaporeSint Maarten (Dutch part)Slovak RepublicSloveniaSmall statesSolomon IslandsSomaliaSouth AfricaSouth AsiaSouth Asia (IDA & IBRD)South SudanSpainSri LankaSt. Kitts and NevisSt. LuciaSt. Martin (French part)St. Vincent and the GrenadinesSub-Saharan Africa Sub-Saharan Africa (excluding high income)Sub-Saharan Africa (IDA & IBRD countries)SudanSurinameSwazilandSwedenSwitzerlandSyrian Arab RepublicTajikistanTanzaniaThailandTimor-LesteTogoTongaTrinidad and TobagoTunisiaTurkeyTurkmenistanTurks and Caicos IslandsTuvaluUgandaUkraineUnited Arab EmiratesUnited KingdomUnited StatesUpper middle incomeUruguayUzbekistanVanuatuVenezuela, RBVietnamVirgin Islands (U.S.)West Bank and GazaWorldYemen, Rep.ZambiaZimbabwe Timeline:
This timeline shows a graph from 1961 to 2016 of Greenland. No data until 1960. Number of actual observations by date: 56.
Source name:
World Development Indicators
Source organization:
Derived from total population. Population source: (1) United Nations Population Division. World Population Prospects, (2) United Nations Statistical Division. Population and Vital Statistics Report (various years), (3) Census reports and other statistical
Categories, topics:
Climate Change, Health
Last updated:
apr 23, 2017
Indicators value changes by year
Minimum:
-0.605
jan 1, 1978
At the date of observation
Value
Absolute change
Change from previous value
jan 1, 1961
4.005
+4.005
0.0%
jan 1, 1962
3.626
-0.38
-9.48%
jan 1, 1963
3.785
+0.159
4.39%
jan 1, 1964
3.922
+0.137
3.62%
jan 1, 1965
3.244
-0.679
-17.3%
jan 1, 1966
4.167
+0.924
28.48%
jan 1, 1967
3.263
-0.905
-21.71%
jan 1, 1968
3.398
+0.136
4.16%
jan 1, 1969
3.517
+0.119
3.5%
jan 1, 1970
3.398
-0.12
-3.4%
jan 1, 1971
3.286
-0.112
-3.29%
jan 1, 1972
1.709
-1.577
-47.98%
jan 1, 1973
2.304
+0.594
34.77%
jan 1, 1974
1.439
-0.865
-37.54%
jan 1, 1975
1.015
-0.424
-29.44%
jan 1, 1976
0.202
-0.813
-80.12%
jan 1, 1977
0.201
0.0
-0.2%
jan 1, 1978
-0.605
-0.807
-400.61%
jan 1, 1979
-0.406
+0.2
-33.0%
jan 1, 1980
0.81
+1.215
-299.6%
jan 1, 1981
1.202
+0.393
48.5%
jan 1, 1982
1.581
+0.379
31.49%
jan 1, 1983
0.976
-0.605
-38.29%
jan 1, 1984
1.158
+0.183
18.73%
jan 1, 1985
1.145
-0.013
-1.15%
jan 1, 1986
0.944
-0.201
-17.53%
jan 1, 1987
0.562
-0.382
-40.45%
jan 1, 1988
1.115
+0.553
98.33%
jan 1, 1989
1.286
+0.17
15.27%
jan 1, 1990
0.908
-0.377
-29.35%
jan 1, 1991
0.541
-0.367
-40.43%
jan 1, 1992
-0.18
-0.721
-133.27%
jan 1, 1993
-0.361
-0.181
100.54%
jan 1, 1994
-0.181
+0.18
-49.86%
jan 1, 1995
0.542
+0.723
-399.46%
jan 1, 1996
0.539
-0.003
-0.54%
jan 1, 1997
0.179
-0.36
-66.79%
jan 1, 1998
0.179
0.0
-0.18%
jan 1, 1999
0.178
0.0
-0.18%
jan 1, 2000
0.0
-0.178
-100.0%
jan 1, 2001
0.178
+0.178
%
jan 1, 2002
0.267
+0.088
49.67%
jan 1, 2003
0.459
+0.192
72.04%
jan 1, 2004
0.275
-0.183
-39.99%
jan 1, 2005
0.257
-0.018
-6.66%
jan 1, 2006
0.042
-0.215
-83.59%
jan 1, 2007
-0.283
-0.325
-771.64%
jan 1, 2008
-0.386
-0.103
36.48%
jan 1, 2009
-0.402
-0.016
4.06%
jan 1, 2010
-0.009
+0.393
-97.79%
jan 1, 2011
1.028
+1.037
-11.68K%
jan 1, 2012
-0.026
-1.054
-102.56%
jan 1, 2013
-0.141
-0.114
433.78%
jan 1, 2014
-0.577
-0.437
310.22%
jan 1, 2015
-0.333
+0.244
-42.25%
jan 1, 2016
-0.322
+0.011
-3.41%
Ranking of countries by current statistics by years


Comments: