29
/
en
AIzaSyAYiBZKx7MnpbEhh9jyipgxe19OcubqV5w
April 1, 2024
216943
Pakistan
PAK
true
2
1
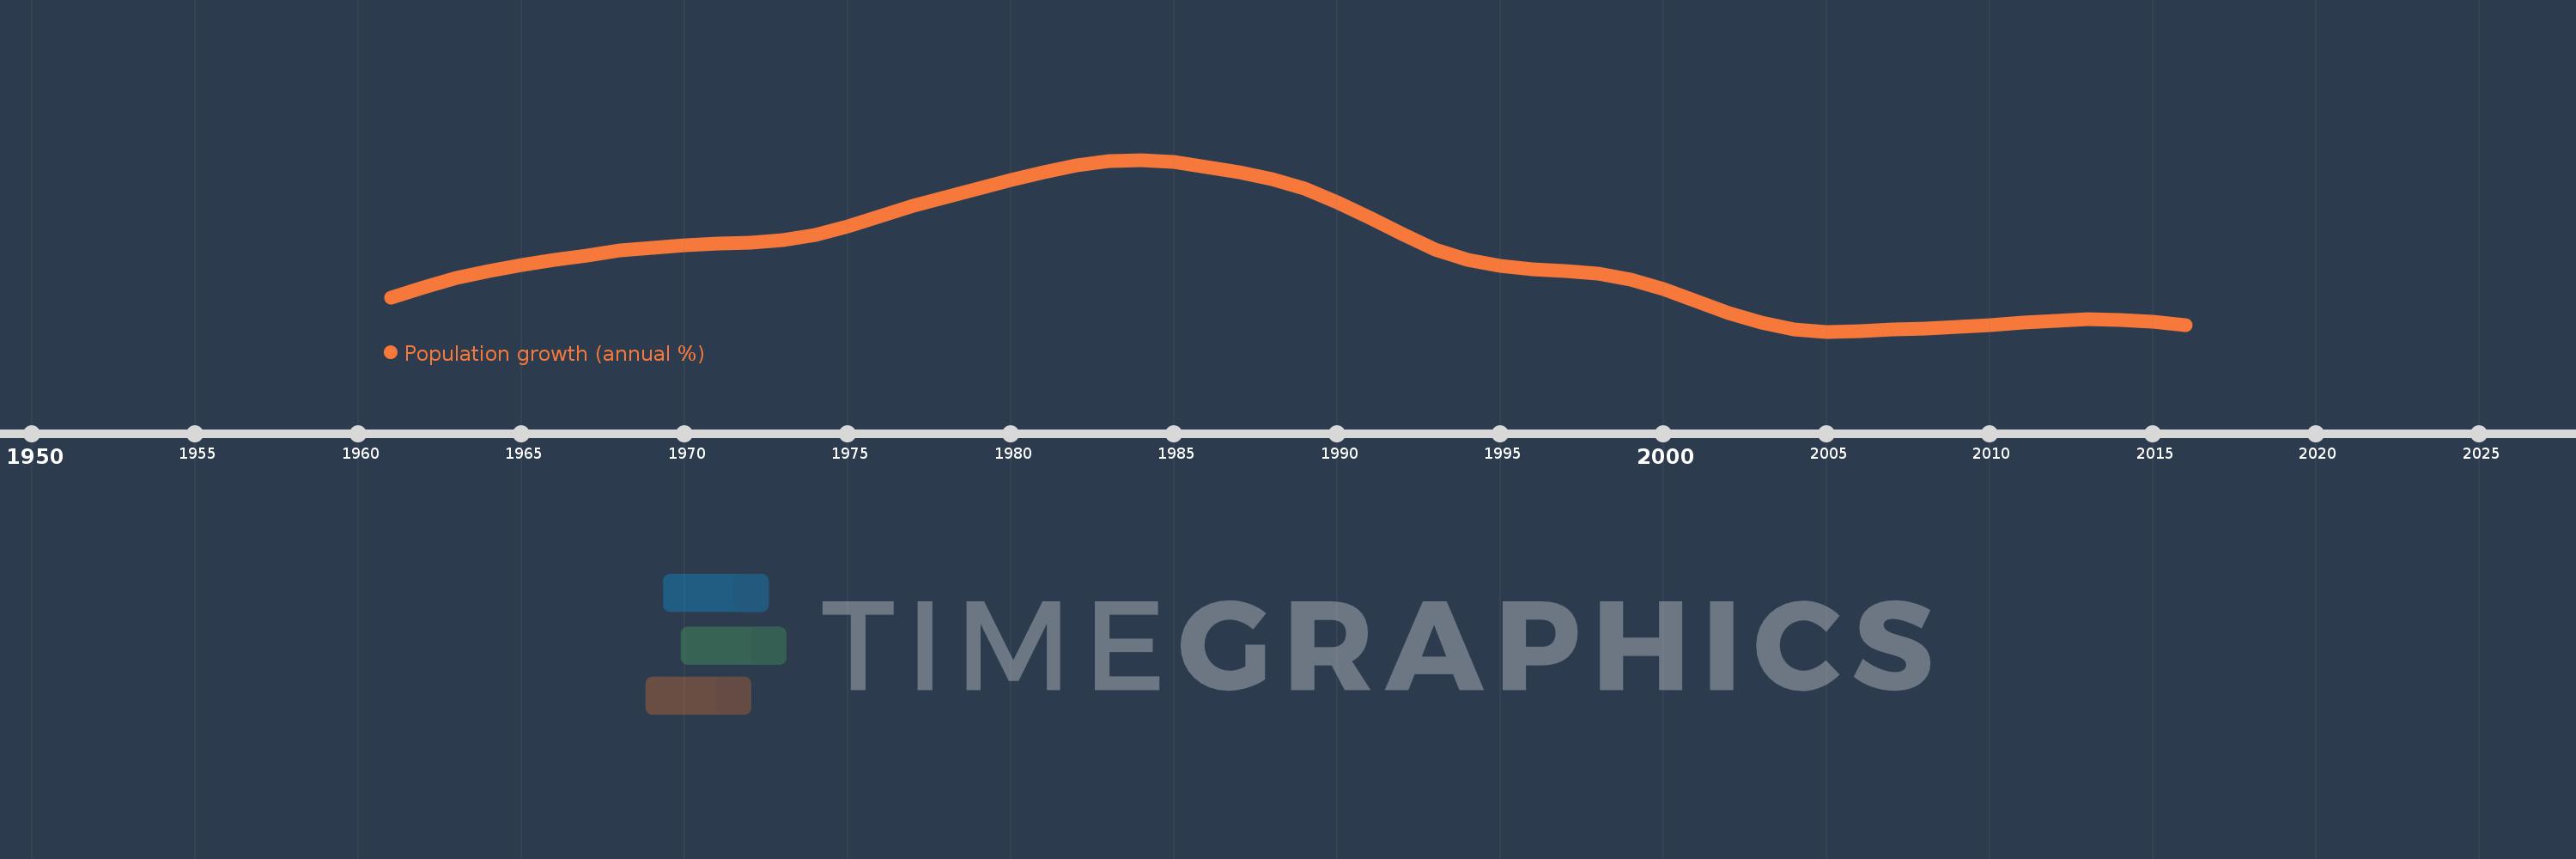
Population growth (annual %)
2016,2015,2014,2013,2012,2011,2010,2009,2008,2007,2006,2005,2004,2003,2002,2001,2000,1999,1998,1997,1996,1995,1994,1993,1992,1991,1990,1989,1988,1987,1986,1985,1984,1983,1982,1981,1980,1979,1978,1977,1976,1975,1974,1973,1972,1971,1970,1969,1968,1967,1966,1965,1964,1963,1962,1961
This statistics in other country:
AfghanistanAlbaniaAlgeriaAmerican SamoaAndorraAngolaAntigua and BarbudaArab WorldArgentinaArmeniaArubaAustraliaAustriaAzerbaijanBahamas, TheBahrainBangladeshBarbadosBelarusBelgiumBelizeBeninBermudaBhutanBoliviaBosnia and HerzegovinaBotswanaBrazilBritish Virgin IslandsBrunei DarussalamBulgariaBurkina FasoBurundiCabo VerdeCambodiaCameroonCanadaCaribbean small statesCayman IslandsCentral African RepublicCentral Europe and the BalticsChadChannel IslandsChileChinaColombiaComorosCongo, Dem. Rep.Congo, Rep.Costa RicaCote d'IvoireCroatiaCubaCuracaoCyprusCzech RepublicDenmarkDjiboutiDominicaDominican RepublicEarly-demographic dividendEast Asia & PacificEast Asia & Pacific (excluding high income)East Asia & Pacific (IDA & IBRD countries)EcuadorEgypt, Arab Rep.El SalvadorEquatorial GuineaEritreaEstoniaEthiopiaEuro areaEurope & Central AsiaEurope & Central Asia (excluding high income)Europe & Central Asia (IDA & IBRD countries)European UnionFaroe IslandsFijiFinlandFragile and conflict affected situationsFranceFrench PolynesiaGabonGambia, TheGeorgiaGermanyGhanaGibraltarGreeceGreenlandGrenadaGuamGuatemalaGuineaGuinea-BissauGuyanaHaitiHeavily indebted poor countries (HIPC)High incomeHondurasHong Kong SAR, ChinaHungaryIBRD onlyIcelandIDA & IBRD totalIDA blendIDA onlyIDA totalIndiaIndonesiaIran, Islamic Rep.IraqIrelandIsle of ManIsraelItalyJamaicaJapanJordanKazakhstanKenyaKiribatiKorea, Dem. People’s Rep.Korea, Rep.KosovoKuwaitKyrgyz RepublicLao PDRLate-demographic dividendLatin America & Caribbean Latin America & Caribbean (excluding high income)Latin America & the Caribbean (IDA & IBRD countries)LatviaLeast developed countries: UN classificationLebanonLesothoLiberiaLibyaLiechtensteinLithuaniaLow & middle incomeLow incomeLower middle incomeLuxembourgMacao SAR, ChinaMacedonia, FYRMadagascarMalawiMalaysiaMaldivesMaliMaltaMarshall IslandsMauritaniaMauritiusMexicoMicronesia, Fed. Sts.Middle East & North AfricaMiddle East & North Africa (excluding high income)Middle East & North Africa (IDA & IBRD countries)Middle incomeMoldovaMonacoMongoliaMontenegroMoroccoMozambiqueMyanmarNamibiaNauruNepalNetherlandsNew CaledoniaNew ZealandNicaraguaNigerNigeriaNorth AmericaNorthern Mariana IslandsNorwayOECD membersOmanOther small statesPacific island small statesPakistanPalauPanamaPapua New GuineaParaguayPeruPhilippinesPolandPortugalPost-demographic dividendPre-demographic dividendPuerto RicoQatarRomaniaRussian FederationRwandaSamoaSan MarinoSao Tome and PrincipeSaudi ArabiaSenegalSerbiaSeychellesSierra LeoneSingaporeSint Maarten (Dutch part)Slovak RepublicSloveniaSmall statesSolomon IslandsSomaliaSouth AfricaSouth AsiaSouth Asia (IDA & IBRD)South SudanSpainSri LankaSt. Kitts and NevisSt. LuciaSt. Martin (French part)St. Vincent and the GrenadinesSub-Saharan Africa Sub-Saharan Africa (excluding high income)Sub-Saharan Africa (IDA & IBRD countries)SudanSurinameSwazilandSwedenSwitzerlandSyrian Arab RepublicTajikistanTanzaniaThailandTimor-LesteTogoTongaTrinidad and TobagoTunisiaTurkeyTurkmenistanTurks and Caicos IslandsTuvaluUgandaUkraineUnited Arab EmiratesUnited KingdomUnited StatesUpper middle incomeUruguayUzbekistanVanuatuVenezuela, RBVietnamVirgin Islands (U.S.)West Bank and GazaWorldYemen, Rep.ZambiaZimbabwe Timeline:
This timeline shows a graph from 1961 to 2016 of Pakistan. No data until 1960. Number of actual observations by date: 56.
Source name:
World Development Indicators
Source organization:
Derived from total population. Population source: (1) United Nations Population Division. World Population Prospects, (2) United Nations Statistical Division. Population and Vital Statistics Report (various years), (3) Census reports and other statistical
Categories, topics:
Climate Change, Health
Last updated:
apr 23, 2017
Indicators value changes by year
At the date of observation
Value
Absolute change
Change from previous value
jan 1, 1961
2.291
+2.291
0.0%
jan 1, 1962
2.369
+0.078
3.39%
jan 1, 1963
2.437
+0.068
2.87%
jan 1, 1964
2.494
+0.057
2.34%
jan 1, 1965
2.539
+0.046
1.83%
jan 1, 1966
2.576
+0.037
1.45%
jan 1, 1967
2.612
+0.036
1.4%
jan 1, 1968
2.647
+0.034
1.31%
jan 1, 1969
2.672
+0.026
0.97%
jan 1, 1970
2.689
+0.016
0.61%
jan 1, 1971
2.701
+0.013
0.47%
jan 1, 1972
2.711
+0.009
0.34%
jan 1, 1973
2.728
+0.017
0.64%
jan 1, 1974
2.767
+0.039
1.42%
jan 1, 1975
2.832
+0.065
2.36%
jan 1, 1976
2.913
+0.081
2.87%
jan 1, 1977
2.99
+0.076
2.62%
jan 1, 1978
3.056
+0.066
2.21%
jan 1, 1979
3.122
+0.067
2.18%
jan 1, 1980
3.189
+0.066
2.13%
jan 1, 1981
3.249
+0.061
1.9%
jan 1, 1982
3.3
+0.051
1.57%
jan 1, 1983
3.334
+0.034
1.02%
jan 1, 1984
3.344
+0.01
0.3%
jan 1, 1985
3.327
-0.017
-0.5%
jan 1, 1986
3.289
-0.038
-1.15%
jan 1, 1987
3.247
-0.042
-1.26%
jan 1, 1988
3.199
-0.049
-1.5%
jan 1, 1989
3.124
-0.075
-2.34%
jan 1, 1990
3.02
-0.103
-3.31%
jan 1, 1991
2.901
-0.119
-3.95%
jan 1, 1992
2.774
-0.127
-4.38%
jan 1, 1993
2.659
-0.114
-4.13%
jan 1, 1994
2.575
-0.085
-3.18%
jan 1, 1995
2.529
-0.046
-1.8%
jan 1, 1996
2.507
-0.022
-0.87%
jan 1, 1997
2.495
-0.011
-0.44%
jan 1, 1998
2.474
-0.022
-0.88%
jan 1, 1999
2.429
-0.045
-1.8%
jan 1, 2000
2.354
-0.075
-3.09%
jan 1, 2001
2.262
-0.092
-3.9%
jan 1, 2002
2.169
-0.093
-4.11%
jan 1, 2003
2.094
-0.075
-3.47%
jan 1, 2004
2.044
-0.049
-2.36%
jan 1, 2005
2.028
-0.017
-0.81%
jan 1, 2006
2.034
+0.007
0.33%
jan 1, 2007
2.045
+0.01
0.5%
jan 1, 2008
2.051
+0.006
0.31%
jan 1, 2009
2.062
+0.011
0.56%
jan 1, 2010
2.078
+0.015
0.74%
jan 1, 2011
2.094
+0.016
0.77%
jan 1, 2012
2.11
+0.016
0.78%
jan 1, 2013
2.121
+0.011
0.52%
jan 1, 2014
2.12
-0.001
-0.05%
jan 1, 2015
2.103
-0.016
-0.77%
jan 1, 2016
2.075
-0.028
-1.33%
Ranking of countries by current statistics by years


Comments: