29
/
en
AIzaSyAYiBZKx7MnpbEhh9jyipgxe19OcubqV5w
April 1, 2024
204538
Myanmar
MMR
true
2
1
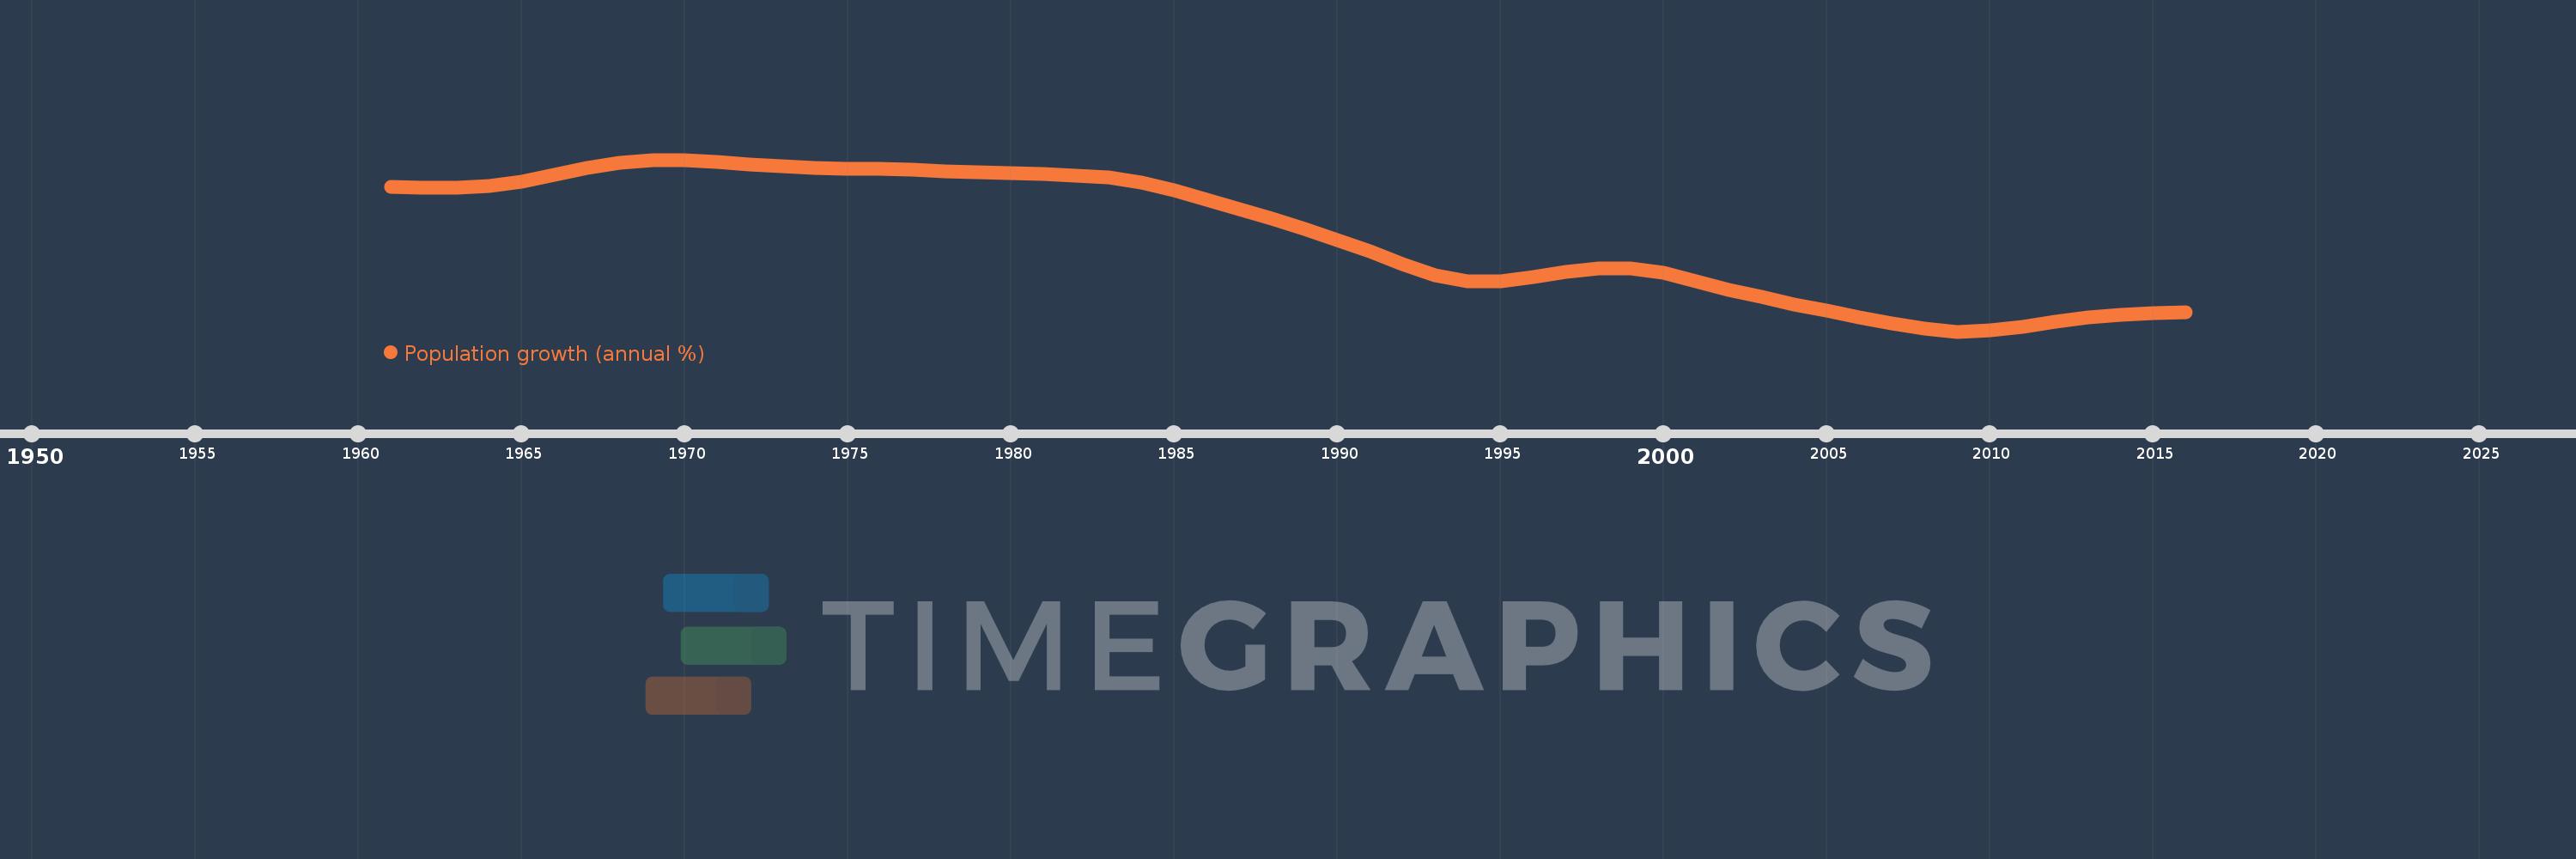
Population growth (annual %)
2016,2015,2014,2013,2012,2011,2010,2009,2008,2007,2006,2005,2004,2003,2002,2001,2000,1999,1998,1997,1996,1995,1994,1993,1992,1991,1990,1989,1988,1987,1986,1985,1984,1983,1982,1981,1980,1979,1978,1977,1976,1975,1974,1973,1972,1971,1970,1969,1968,1967,1966,1965,1964,1963,1962,1961
This statistics in other country:
AfghanistanAlbaniaAlgeriaAmerican SamoaAndorraAngolaAntigua and BarbudaArab WorldArgentinaArmeniaArubaAustraliaAustriaAzerbaijanBahamas, TheBahrainBangladeshBarbadosBelarusBelgiumBelizeBeninBermudaBhutanBoliviaBosnia and HerzegovinaBotswanaBrazilBritish Virgin IslandsBrunei DarussalamBulgariaBurkina FasoBurundiCabo VerdeCambodiaCameroonCanadaCaribbean small statesCayman IslandsCentral African RepublicCentral Europe and the BalticsChadChannel IslandsChileChinaColombiaComorosCongo, Dem. Rep.Congo, Rep.Costa RicaCote d'IvoireCroatiaCubaCuracaoCyprusCzech RepublicDenmarkDjiboutiDominicaDominican RepublicEarly-demographic dividendEast Asia & PacificEast Asia & Pacific (excluding high income)East Asia & Pacific (IDA & IBRD countries)EcuadorEgypt, Arab Rep.El SalvadorEquatorial GuineaEritreaEstoniaEthiopiaEuro areaEurope & Central AsiaEurope & Central Asia (excluding high income)Europe & Central Asia (IDA & IBRD countries)European UnionFaroe IslandsFijiFinlandFragile and conflict affected situationsFranceFrench PolynesiaGabonGambia, TheGeorgiaGermanyGhanaGibraltarGreeceGreenlandGrenadaGuamGuatemalaGuineaGuinea-BissauGuyanaHaitiHeavily indebted poor countries (HIPC)High incomeHondurasHong Kong SAR, ChinaHungaryIBRD onlyIcelandIDA & IBRD totalIDA blendIDA onlyIDA totalIndiaIndonesiaIran, Islamic Rep.IraqIrelandIsle of ManIsraelItalyJamaicaJapanJordanKazakhstanKenyaKiribatiKorea, Dem. People’s Rep.Korea, Rep.KosovoKuwaitKyrgyz RepublicLao PDRLate-demographic dividendLatin America & Caribbean Latin America & Caribbean (excluding high income)Latin America & the Caribbean (IDA & IBRD countries)LatviaLeast developed countries: UN classificationLebanonLesothoLiberiaLibyaLiechtensteinLithuaniaLow & middle incomeLow incomeLower middle incomeLuxembourgMacao SAR, ChinaMacedonia, FYRMadagascarMalawiMalaysiaMaldivesMaliMaltaMarshall IslandsMauritaniaMauritiusMexicoMicronesia, Fed. Sts.Middle East & North AfricaMiddle East & North Africa (excluding high income)Middle East & North Africa (IDA & IBRD countries)Middle incomeMoldovaMonacoMongoliaMontenegroMoroccoMozambiqueMyanmarNamibiaNauruNepalNetherlandsNew CaledoniaNew ZealandNicaraguaNigerNigeriaNorth AmericaNorthern Mariana IslandsNorwayOECD membersOmanOther small statesPacific island small statesPakistanPalauPanamaPapua New GuineaParaguayPeruPhilippinesPolandPortugalPost-demographic dividendPre-demographic dividendPuerto RicoQatarRomaniaRussian FederationRwandaSamoaSan MarinoSao Tome and PrincipeSaudi ArabiaSenegalSerbiaSeychellesSierra LeoneSingaporeSint Maarten (Dutch part)Slovak RepublicSloveniaSmall statesSolomon IslandsSomaliaSouth AfricaSouth AsiaSouth Asia (IDA & IBRD)South SudanSpainSri LankaSt. Kitts and NevisSt. LuciaSt. Martin (French part)St. Vincent and the GrenadinesSub-Saharan Africa Sub-Saharan Africa (excluding high income)Sub-Saharan Africa (IDA & IBRD countries)SudanSurinameSwazilandSwedenSwitzerlandSyrian Arab RepublicTajikistanTanzaniaThailandTimor-LesteTogoTongaTrinidad and TobagoTunisiaTurkeyTurkmenistanTurks and Caicos IslandsTuvaluUgandaUkraineUnited Arab EmiratesUnited KingdomUnited StatesUpper middle incomeUruguayUzbekistanVanuatuVenezuela, RBVietnamVirgin Islands (U.S.)West Bank and GazaWorldYemen, Rep.ZambiaZimbabwe Timeline:
This timeline shows a graph from 1961 to 2016 of Myanmar. No data until 1960. Number of actual observations by date: 56.
Source name:
World Development Indicators
Source organization:
Derived from total population. Population source: (1) United Nations Population Division. World Population Prospects, (2) United Nations Statistical Division. Population and Vital Statistics Report (various years), (3) Census reports and other statistical
Categories, topics:
Climate Change, Health
Last updated:
apr 23, 2017
Indicators value changes by year
At the date of observation
Value
Absolute change
Change from previous value
jan 1, 1961
2.198
+2.198
0.0%
jan 1, 1962
2.187
-0.01
-0.46%
jan 1, 1963
2.185
-0.003
-0.12%
jan 1, 1964
2.206
+0.021
0.95%
jan 1, 1965
2.257
+0.052
2.34%
jan 1, 1966
2.327
+0.069
3.07%
jan 1, 1967
2.399
+0.072
3.1%
jan 1, 1968
2.455
+0.056
2.34%
jan 1, 1969
2.486
+0.032
1.29%
jan 1, 1970
2.487
+0.001
0.02%
jan 1, 1971
2.466
-0.021
-0.83%
jan 1, 1972
2.439
-0.028
-1.12%
jan 1, 1973
2.416
-0.023
-0.94%
jan 1, 1974
2.399
-0.017
-0.69%
jan 1, 1975
2.392
-0.007
-0.29%
jan 1, 1976
2.391
-0.001
-0.06%
jan 1, 1977
2.382
-0.008
-0.35%
jan 1, 1978
2.366
-0.016
-0.67%
jan 1, 1979
2.353
-0.013
-0.56%
jan 1, 1980
2.344
-0.009
-0.4%
jan 1, 1981
2.333
-0.011
-0.46%
jan 1, 1982
2.32
-0.012
-0.54%
jan 1, 1983
2.295
-0.026
-1.1%
jan 1, 1984
2.244
-0.051
-2.24%
jan 1, 1985
2.161
-0.082
-3.67%
jan 1, 1986
2.058
-0.104
-4.8%
jan 1, 1987
1.955
-0.102
-4.98%
jan 1, 1988
1.857
-0.098
-5.0%
jan 1, 1989
1.749
-0.109
-5.85%
jan 1, 1990
1.629
-0.12
-6.88%
jan 1, 1991
1.505
-0.123
-7.56%
jan 1, 1992
1.373
-0.133
-8.8%
jan 1, 1993
1.256
-0.117
-8.53%
jan 1, 1994
1.19
-0.066
-5.29%
jan 1, 1995
1.189
-0.001
-0.08%
jan 1, 1996
1.231
+0.042
3.54%
jan 1, 1997
1.289
+0.058
4.73%
jan 1, 1998
1.327
+0.038
2.98%
jan 1, 1999
1.328
+0.001
0.07%
jan 1, 2000
1.276
-0.052
-3.91%
jan 1, 2001
1.188
-0.088
-6.92%
jan 1, 2002
1.097
-0.091
-7.63%
jan 1, 2003
1.02
-0.077
-7.0%
jan 1, 2004
0.944
-0.076
-7.44%
jan 1, 2005
0.873
-0.072
-7.6%
jan 1, 2006
0.807
-0.065
-7.48%
jan 1, 2007
0.739
-0.068
-8.45%
jan 1, 2008
0.679
-0.06
-8.1%
jan 1, 2009
0.651
-0.028
-4.15%
jan 1, 2010
0.664
+0.012
1.9%
jan 1, 2011
0.705
+0.041
6.21%
jan 1, 2012
0.756
+0.051
7.23%
jan 1, 2013
0.8
+0.044
5.81%
jan 1, 2014
0.834
+0.034
4.3%
jan 1, 2015
0.852
+0.018
2.17%
jan 1, 2016
0.857
+0.005
0.61%
Ranking of countries by current statistics by years


Comments: