29
/
en
AIzaSyAYiBZKx7MnpbEhh9jyipgxe19OcubqV5w
April 1, 2024
140898
Ghana
GHA
true
2
1
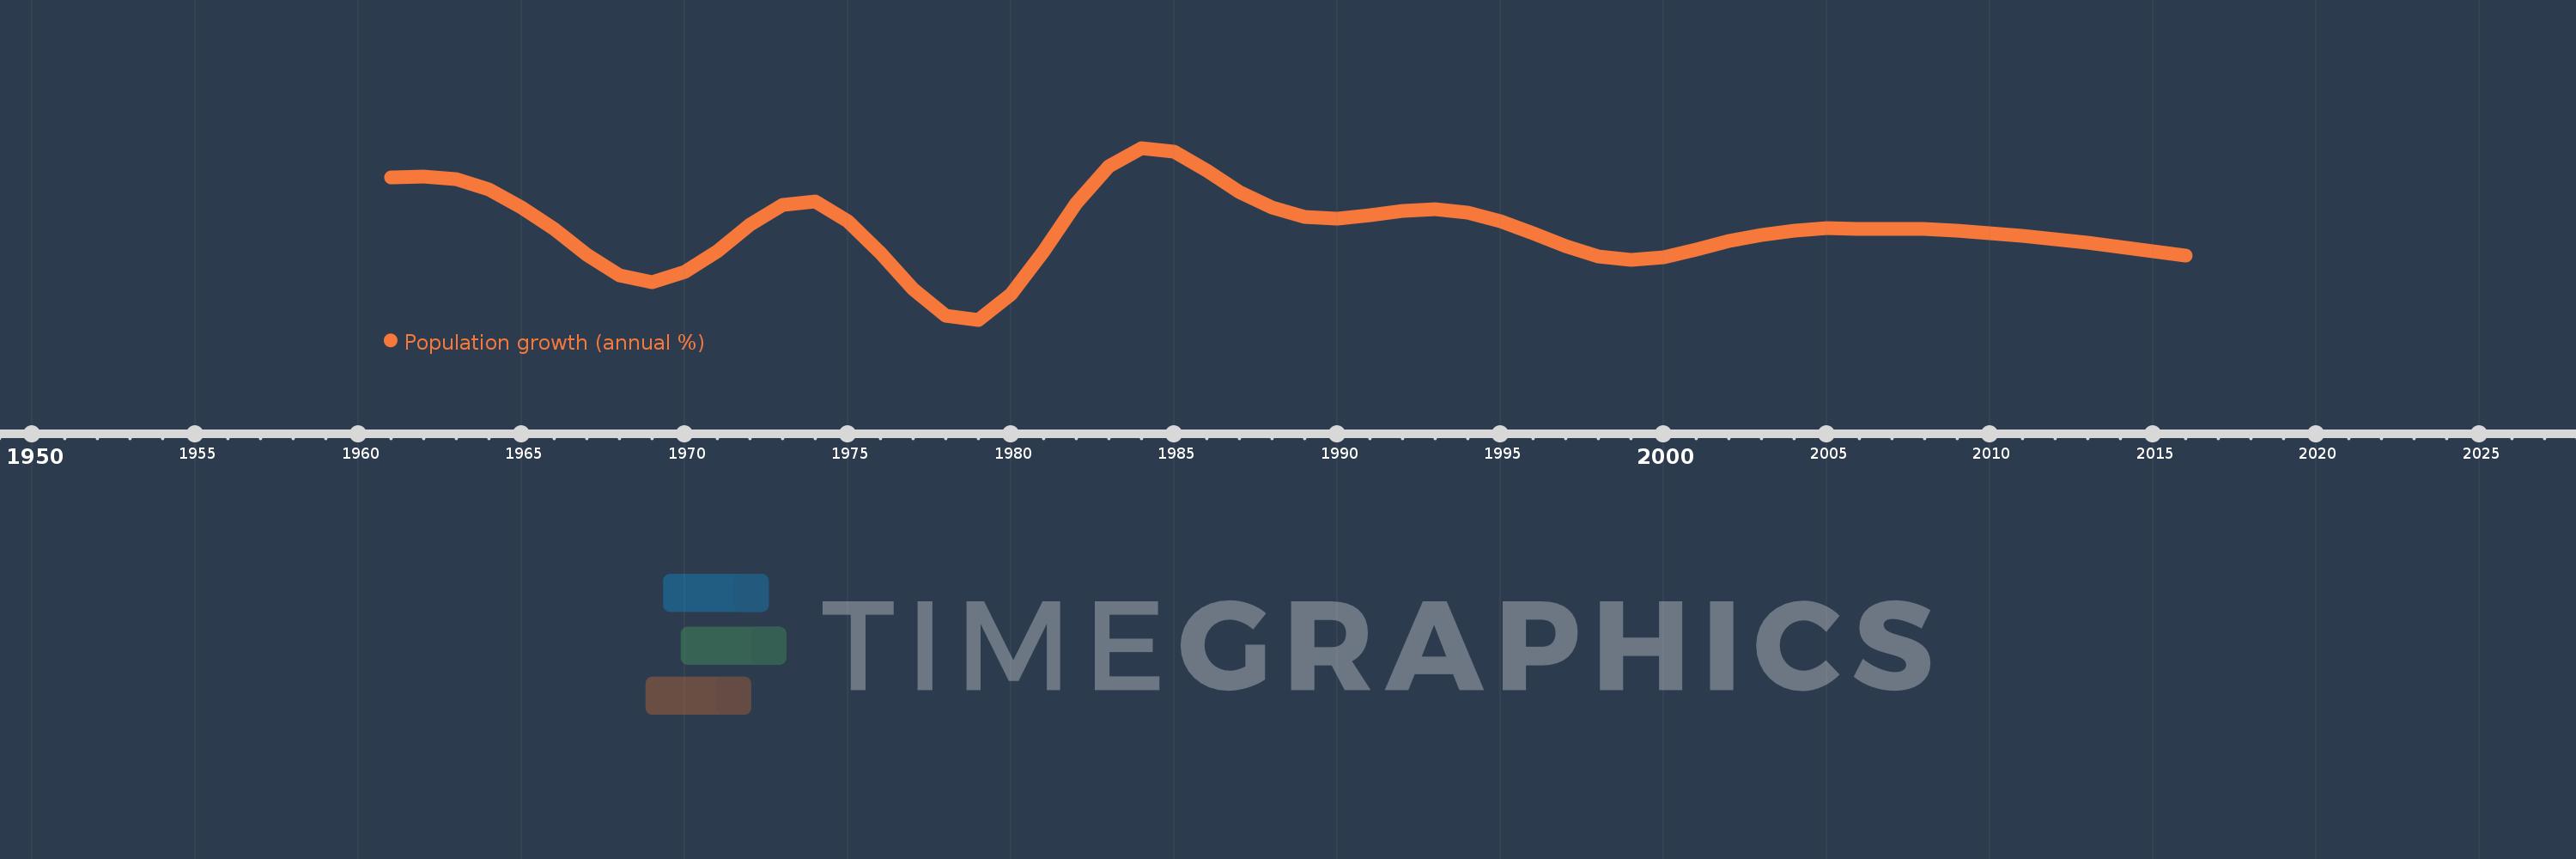
Population growth (annual %)
2016,2015,2014,2013,2012,2011,2010,2009,2008,2007,2006,2005,2004,2003,2002,2001,2000,1999,1998,1997,1996,1995,1994,1993,1992,1991,1990,1989,1988,1987,1986,1985,1984,1983,1982,1981,1980,1979,1978,1977,1976,1975,1974,1973,1972,1971,1970,1969,1968,1967,1966,1965,1964,1963,1962,1961
This statistics in other country:
AfghanistanAlbaniaAlgeriaAmerican SamoaAndorraAngolaAntigua and BarbudaArab WorldArgentinaArmeniaArubaAustraliaAustriaAzerbaijanBahamas, TheBahrainBangladeshBarbadosBelarusBelgiumBelizeBeninBermudaBhutanBoliviaBosnia and HerzegovinaBotswanaBrazilBritish Virgin IslandsBrunei DarussalamBulgariaBurkina FasoBurundiCabo VerdeCambodiaCameroonCanadaCaribbean small statesCayman IslandsCentral African RepublicCentral Europe and the BalticsChadChannel IslandsChileChinaColombiaComorosCongo, Dem. Rep.Congo, Rep.Costa RicaCote d'IvoireCroatiaCubaCuracaoCyprusCzech RepublicDenmarkDjiboutiDominicaDominican RepublicEarly-demographic dividendEast Asia & PacificEast Asia & Pacific (excluding high income)East Asia & Pacific (IDA & IBRD countries)EcuadorEgypt, Arab Rep.El SalvadorEquatorial GuineaEritreaEstoniaEthiopiaEuro areaEurope & Central AsiaEurope & Central Asia (excluding high income)Europe & Central Asia (IDA & IBRD countries)European UnionFaroe IslandsFijiFinlandFragile and conflict affected situationsFranceFrench PolynesiaGabonGambia, TheGeorgiaGermanyGhanaGibraltarGreeceGreenlandGrenadaGuamGuatemalaGuineaGuinea-BissauGuyanaHaitiHeavily indebted poor countries (HIPC)High incomeHondurasHong Kong SAR, ChinaHungaryIBRD onlyIcelandIDA & IBRD totalIDA blendIDA onlyIDA totalIndiaIndonesiaIran, Islamic Rep.IraqIrelandIsle of ManIsraelItalyJamaicaJapanJordanKazakhstanKenyaKiribatiKorea, Dem. People’s Rep.Korea, Rep.KosovoKuwaitKyrgyz RepublicLao PDRLate-demographic dividendLatin America & Caribbean Latin America & Caribbean (excluding high income)Latin America & the Caribbean (IDA & IBRD countries)LatviaLeast developed countries: UN classificationLebanonLesothoLiberiaLibyaLiechtensteinLithuaniaLow & middle incomeLow incomeLower middle incomeLuxembourgMacao SAR, ChinaMacedonia, FYRMadagascarMalawiMalaysiaMaldivesMaliMaltaMarshall IslandsMauritaniaMauritiusMexicoMicronesia, Fed. Sts.Middle East & North AfricaMiddle East & North Africa (excluding high income)Middle East & North Africa (IDA & IBRD countries)Middle incomeMoldovaMonacoMongoliaMontenegroMoroccoMozambiqueMyanmarNamibiaNauruNepalNetherlandsNew CaledoniaNew ZealandNicaraguaNigerNigeriaNorth AmericaNorthern Mariana IslandsNorwayOECD membersOmanOther small statesPacific island small statesPakistanPalauPanamaPapua New GuineaParaguayPeruPhilippinesPolandPortugalPost-demographic dividendPre-demographic dividendPuerto RicoQatarRomaniaRussian FederationRwandaSamoaSan MarinoSao Tome and PrincipeSaudi ArabiaSenegalSerbiaSeychellesSierra LeoneSingaporeSint Maarten (Dutch part)Slovak RepublicSloveniaSmall statesSolomon IslandsSomaliaSouth AfricaSouth AsiaSouth Asia (IDA & IBRD)South SudanSpainSri LankaSt. Kitts and NevisSt. LuciaSt. Martin (French part)St. Vincent and the GrenadinesSub-Saharan Africa Sub-Saharan Africa (excluding high income)Sub-Saharan Africa (IDA & IBRD countries)SudanSurinameSwazilandSwedenSwitzerlandSyrian Arab RepublicTajikistanTanzaniaThailandTimor-LesteTogoTongaTrinidad and TobagoTunisiaTurkeyTurkmenistanTurks and Caicos IslandsTuvaluUgandaUkraineUnited Arab EmiratesUnited KingdomUnited StatesUpper middle incomeUruguayUzbekistanVanuatuVenezuela, RBVietnamVirgin Islands (U.S.)West Bank and GazaWorldYemen, Rep.ZambiaZimbabwe Timeline:
This timeline shows a graph from 1961 to 2016 of Ghana. No data until 1960. Number of actual observations by date: 56.
Source name:
World Development Indicators
Source organization:
Derived from total population. Population source: (1) United Nations Population Division. World Population Prospects, (2) United Nations Statistical Division. Population and Vital Statistics Report (various years), (3) Census reports and other statistical
Categories, topics:
Climate Change, Health
Last updated:
apr 23, 2017
Indicators value changes by year
At the date of observation
Value
Absolute change
Change from previous value
jan 1, 1961
3.161
+3.161
0.0%
jan 1, 1962
3.17
+0.009
0.28%
jan 1, 1963
3.138
-0.032
-1.0%
jan 1, 1964
3.03
-0.108
-3.46%
jan 1, 1965
2.833
-0.197
-6.5%
jan 1, 1966
2.592
-0.241
-8.52%
jan 1, 1967
2.313
-0.278
-10.74%
jan 1, 1968
2.087
-0.226
-9.76%
jan 1, 1969
2.01
-0.078
-3.72%
jan 1, 1970
2.122
+0.112
5.59%
jan 1, 1971
2.349
+0.227
10.71%
jan 1, 1972
2.644
+0.294
12.52%
jan 1, 1973
2.862
+0.219
8.27%
jan 1, 1974
2.892
+0.03
1.04%
jan 1, 1975
2.682
-0.21
-7.26%
jan 1, 1976
2.337
-0.345
-12.85%
jan 1, 1977
1.935
-0.403
-17.23%
jan 1, 1978
1.647
-0.288
-14.89%
jan 1, 1979
1.602
-0.044
-2.69%
jan 1, 1980
1.878
+0.275
17.19%
jan 1, 1981
2.353
+0.476
25.33%
jan 1, 1982
2.88
+0.526
22.36%
jan 1, 1983
3.278
+0.399
13.84%
jan 1, 1984
3.482
+0.203
6.2%
jan 1, 1985
3.438
-0.044
-1.26%
jan 1, 1986
3.237
-0.2
-5.83%
jan 1, 1987
3.004
-0.234
-7.22%
jan 1, 1988
2.832
-0.172
-5.71%
jan 1, 1989
2.724
-0.108
-3.82%
jan 1, 1990
2.705
-0.018
-0.67%
jan 1, 1991
2.743
+0.037
1.38%
jan 1, 1992
2.794
+0.051
1.87%
jan 1, 1993
2.811
+0.017
0.59%
jan 1, 1994
2.777
-0.033
-1.18%
jan 1, 1995
2.68
-0.097
-3.5%
jan 1, 1996
2.548
-0.132
-4.94%
jan 1, 1997
2.406
-0.141
-5.55%
jan 1, 1998
2.299
-0.107
-4.44%
jan 1, 1999
2.254
-0.046
-1.99%
jan 1, 2000
2.286
+0.032
1.42%
jan 1, 2001
2.368
+0.083
3.61%
jan 1, 2002
2.46
+0.092
3.87%
jan 1, 2003
2.53
+0.07
2.85%
jan 1, 2004
2.58
+0.05
1.98%
jan 1, 2005
2.601
+0.021
0.81%
jan 1, 2006
2.6
-0.001
-0.03%
jan 1, 2007
2.595
-0.005
-0.19%
jan 1, 2008
2.591
-0.004
-0.17%
jan 1, 2009
2.576
-0.015
-0.57%
jan 1, 2010
2.551
-0.025
-0.98%
jan 1, 2011
2.518
-0.033
-1.31%
jan 1, 2012
2.481
-0.037
-1.47%
jan 1, 2013
2.441
-0.039
-1.59%
jan 1, 2014
2.398
-0.044
-1.79%
jan 1, 2015
2.35
-0.048
-1.98%
jan 1, 2016
2.3
-0.05
-2.12%
Ranking of countries by current statistics by years


Comments: