29
/
en
AIzaSyAYiBZKx7MnpbEhh9jyipgxe19OcubqV5w
April 1, 2024
165335
Jordan
JOR
true
2
1
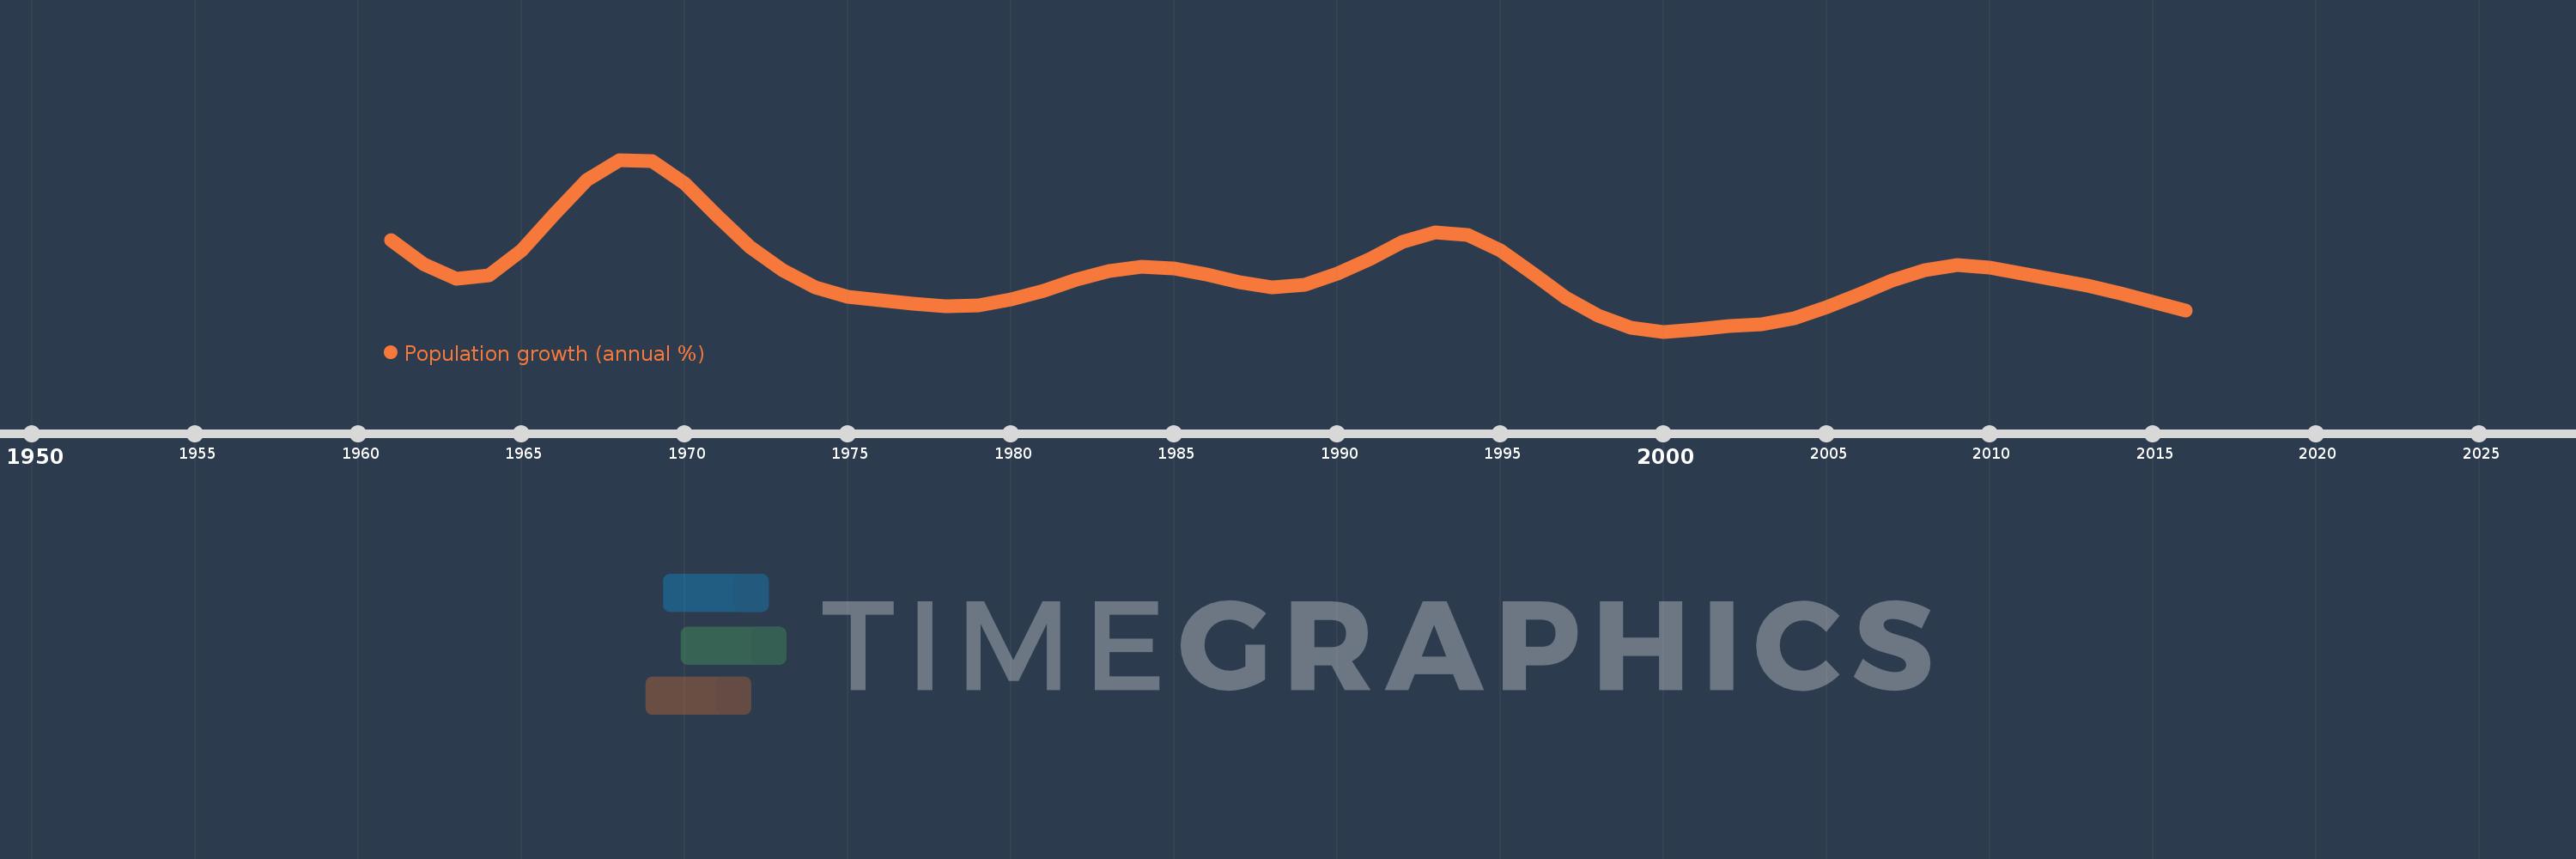
Population growth (annual %)
2016,2015,2014,2013,2012,2011,2010,2009,2008,2007,2006,2005,2004,2003,2002,2001,2000,1999,1998,1997,1996,1995,1994,1993,1992,1991,1990,1989,1988,1987,1986,1985,1984,1983,1982,1981,1980,1979,1978,1977,1976,1975,1974,1973,1972,1971,1970,1969,1968,1967,1966,1965,1964,1963,1962,1961
This statistics in other country:
AfghanistanAlbaniaAlgeriaAmerican SamoaAndorraAngolaAntigua and BarbudaArab WorldArgentinaArmeniaArubaAustraliaAustriaAzerbaijanBahamas, TheBahrainBangladeshBarbadosBelarusBelgiumBelizeBeninBermudaBhutanBoliviaBosnia and HerzegovinaBotswanaBrazilBritish Virgin IslandsBrunei DarussalamBulgariaBurkina FasoBurundiCabo VerdeCambodiaCameroonCanadaCaribbean small statesCayman IslandsCentral African RepublicCentral Europe and the BalticsChadChannel IslandsChileChinaColombiaComorosCongo, Dem. Rep.Congo, Rep.Costa RicaCote d'IvoireCroatiaCubaCuracaoCyprusCzech RepublicDenmarkDjiboutiDominicaDominican RepublicEarly-demographic dividendEast Asia & PacificEast Asia & Pacific (excluding high income)East Asia & Pacific (IDA & IBRD countries)EcuadorEgypt, Arab Rep.El SalvadorEquatorial GuineaEritreaEstoniaEthiopiaEuro areaEurope & Central AsiaEurope & Central Asia (excluding high income)Europe & Central Asia (IDA & IBRD countries)European UnionFaroe IslandsFijiFinlandFragile and conflict affected situationsFranceFrench PolynesiaGabonGambia, TheGeorgiaGermanyGhanaGibraltarGreeceGreenlandGrenadaGuamGuatemalaGuineaGuinea-BissauGuyanaHaitiHeavily indebted poor countries (HIPC)High incomeHondurasHong Kong SAR, ChinaHungaryIBRD onlyIcelandIDA & IBRD totalIDA blendIDA onlyIDA totalIndiaIndonesiaIran, Islamic Rep.IraqIrelandIsle of ManIsraelItalyJamaicaJapanJordanKazakhstanKenyaKiribatiKorea, Dem. People’s Rep.Korea, Rep.KosovoKuwaitKyrgyz RepublicLao PDRLate-demographic dividendLatin America & Caribbean Latin America & Caribbean (excluding high income)Latin America & the Caribbean (IDA & IBRD countries)LatviaLeast developed countries: UN classificationLebanonLesothoLiberiaLibyaLiechtensteinLithuaniaLow & middle incomeLow incomeLower middle incomeLuxembourgMacao SAR, ChinaMacedonia, FYRMadagascarMalawiMalaysiaMaldivesMaliMaltaMarshall IslandsMauritaniaMauritiusMexicoMicronesia, Fed. Sts.Middle East & North AfricaMiddle East & North Africa (excluding high income)Middle East & North Africa (IDA & IBRD countries)Middle incomeMoldovaMonacoMongoliaMontenegroMoroccoMozambiqueMyanmarNamibiaNauruNepalNetherlandsNew CaledoniaNew ZealandNicaraguaNigerNigeriaNorth AmericaNorthern Mariana IslandsNorwayOECD membersOmanOther small statesPacific island small statesPakistanPalauPanamaPapua New GuineaParaguayPeruPhilippinesPolandPortugalPost-demographic dividendPre-demographic dividendPuerto RicoQatarRomaniaRussian FederationRwandaSamoaSan MarinoSao Tome and PrincipeSaudi ArabiaSenegalSerbiaSeychellesSierra LeoneSingaporeSint Maarten (Dutch part)Slovak RepublicSloveniaSmall statesSolomon IslandsSomaliaSouth AfricaSouth AsiaSouth Asia (IDA & IBRD)South SudanSpainSri LankaSt. Kitts and NevisSt. LuciaSt. Martin (French part)St. Vincent and the GrenadinesSub-Saharan Africa Sub-Saharan Africa (excluding high income)Sub-Saharan Africa (IDA & IBRD countries)SudanSurinameSwazilandSwedenSwitzerlandSyrian Arab RepublicTajikistanTanzaniaThailandTimor-LesteTogoTongaTrinidad and TobagoTunisiaTurkeyTurkmenistanTurks and Caicos IslandsTuvaluUgandaUkraineUnited Arab EmiratesUnited KingdomUnited StatesUpper middle incomeUruguayUzbekistanVanuatuVenezuela, RBVietnamVirgin Islands (U.S.)West Bank and GazaWorldYemen, Rep.ZambiaZimbabwe Timeline:
This timeline shows a graph from 1961 to 2016 of Jordan. No data until 1960. Number of actual observations by date: 56.
Source name:
World Development Indicators
Source organization:
Derived from total population. Population source: (1) United Nations Population Division. World Population Prospects, (2) United Nations Statistical Division. Population and Vital Statistics Report (various years), (3) Census reports and other statistical
Categories, topics:
Climate Change, Health
Last updated:
apr 23, 2017
Indicators value changes by year
At the date of observation
Value
Absolute change
Change from previous value
jan 1, 1961
5.305
+5.305
0.0%
jan 1, 1962
4.319
-0.986
-18.59%
jan 1, 1963
3.696
-0.623
-14.42%
jan 1, 1964
3.843
+0.148
3.99%
jan 1, 1965
4.897
+1.054
27.43%
jan 1, 1966
6.367
+1.469
30.0%
jan 1, 1967
7.826
+1.459
22.91%
jan 1, 1968
8.654
+0.829
10.59%
jan 1, 1969
8.599
-0.055
-0.63%
jan 1, 1970
7.663
-0.937
-10.89%
jan 1, 1971
6.31
-1.353
-17.66%
jan 1, 1972
5.017
-1.293
-20.49%
jan 1, 1973
4.053
-0.964
-19.21%
jan 1, 1974
3.347
-0.706
-17.41%
jan 1, 1975
2.965
-0.382
-11.41%
jan 1, 1976
2.819
-0.146
-4.93%
jan 1, 1977
2.684
-0.136
-4.81%
jan 1, 1978
2.547
-0.137
-5.09%
jan 1, 1979
2.593
+0.046
1.81%
jan 1, 1980
2.843
+0.25
9.63%
jan 1, 1981
3.213
+0.37
13.02%
jan 1, 1982
3.659
+0.446
13.89%
jan 1, 1983
4.031
+0.372
10.16%
jan 1, 1984
4.199
+0.168
4.17%
jan 1, 1985
4.116
-0.083
-1.97%
jan 1, 1986
3.897
-0.219
-5.32%
jan 1, 1987
3.571
-0.326
-8.36%
jan 1, 1988
3.351
-0.22
-6.17%
jan 1, 1989
3.438
+0.087
2.59%
jan 1, 1990
3.901
+0.463
13.48%
jan 1, 1991
4.538
+0.636
16.31%
jan 1, 1992
5.227
+0.689
15.19%
jan 1, 1993
5.639
+0.412
7.89%
jan 1, 1994
5.54
-0.099
-1.75%
jan 1, 1995
4.873
-0.668
-12.05%
jan 1, 1996
3.902
-0.97
-19.91%
jan 1, 1997
2.919
-0.984
-25.21%
jan 1, 1998
2.16
-0.759
-25.99%
jan 1, 1999
1.66
-0.5
-23.16%
jan 1, 2000
1.505
-0.155
-9.34%
jan 1, 2001
1.609
+0.104
6.89%
jan 1, 2002
1.721
+0.112
6.98%
jan 1, 2003
1.812
+0.092
5.32%
jan 1, 2004
2.076
+0.264
14.54%
jan 1, 2005
2.528
+0.452
21.77%
jan 1, 2006
3.072
+0.544
21.53%
jan 1, 2007
3.632
+0.559
18.21%
jan 1, 2008
4.061
+0.429
11.82%
jan 1, 2009
4.259
+0.198
4.88%
jan 1, 2010
4.185
-0.075
-1.75%
jan 1, 2011
3.928
-0.257
-6.14%
jan 1, 2012
3.652
-0.275
-7.01%
jan 1, 2013
3.404
-0.248
-6.8%
jan 1, 2014
3.102
-0.302
-8.86%
jan 1, 2015
2.751
-0.351
-11.31%
jan 1, 2016
2.378
-0.373
-13.57%
Ranking of countries by current statistics by years


Comments: