29
/
en
AIzaSyAYiBZKx7MnpbEhh9jyipgxe19OcubqV5w
April 1, 2024
281483
Venezuela, RB
VEN
true
2
1
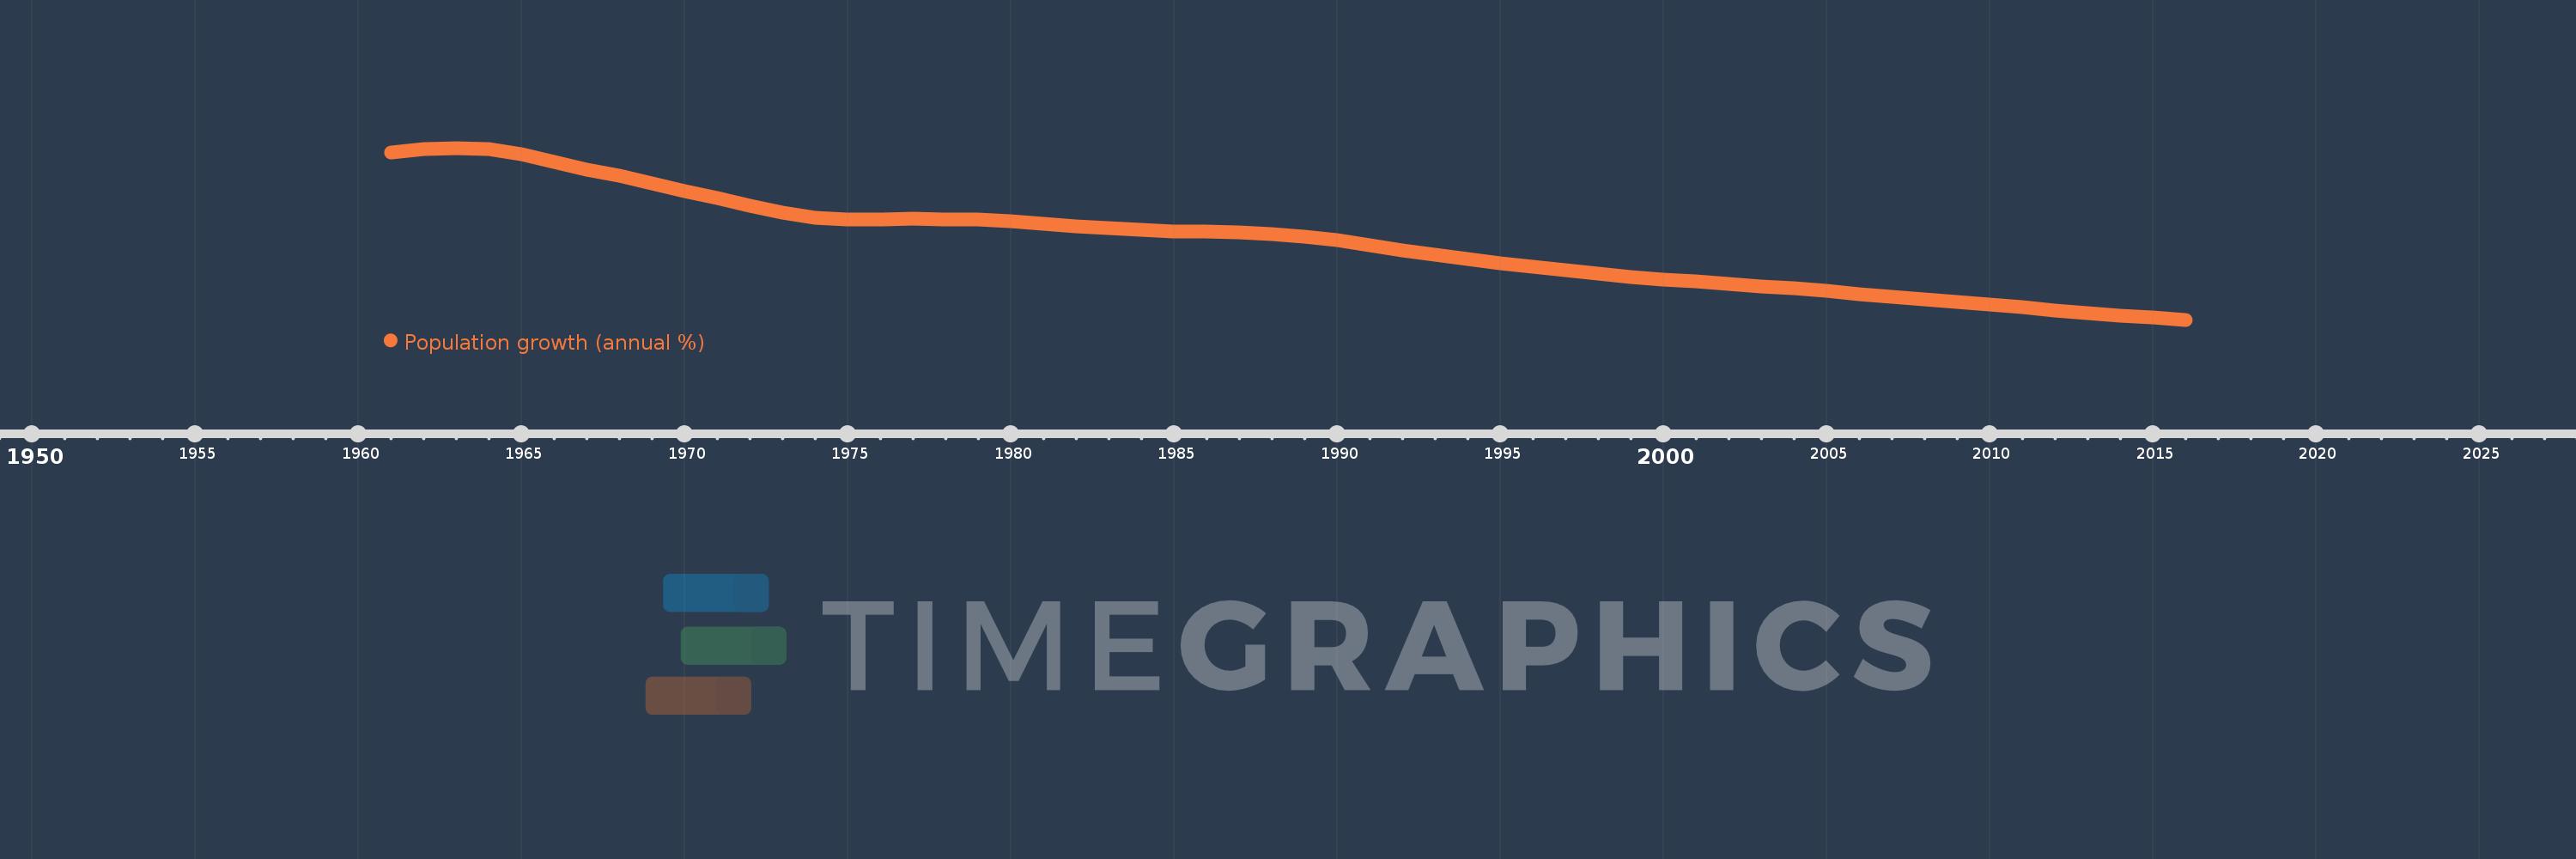
Population growth (annual %)
2016,2015,2014,2013,2012,2011,2010,2009,2008,2007,2006,2005,2004,2003,2002,2001,2000,1999,1998,1997,1996,1995,1994,1993,1992,1991,1990,1989,1988,1987,1986,1985,1984,1983,1982,1981,1980,1979,1978,1977,1976,1975,1974,1973,1972,1971,1970,1969,1968,1967,1966,1965,1964,1963,1962,1961
This statistics in other country:
AfghanistanAlbaniaAlgeriaAmerican SamoaAndorraAngolaAntigua and BarbudaArab WorldArgentinaArmeniaArubaAustraliaAustriaAzerbaijanBahamas, TheBahrainBangladeshBarbadosBelarusBelgiumBelizeBeninBermudaBhutanBoliviaBosnia and HerzegovinaBotswanaBrazilBritish Virgin IslandsBrunei DarussalamBulgariaBurkina FasoBurundiCabo VerdeCambodiaCameroonCanadaCaribbean small statesCayman IslandsCentral African RepublicCentral Europe and the BalticsChadChannel IslandsChileChinaColombiaComorosCongo, Dem. Rep.Congo, Rep.Costa RicaCote d'IvoireCroatiaCubaCuracaoCyprusCzech RepublicDenmarkDjiboutiDominicaDominican RepublicEarly-demographic dividendEast Asia & PacificEast Asia & Pacific (excluding high income)East Asia & Pacific (IDA & IBRD countries)EcuadorEgypt, Arab Rep.El SalvadorEquatorial GuineaEritreaEstoniaEthiopiaEuro areaEurope & Central AsiaEurope & Central Asia (excluding high income)Europe & Central Asia (IDA & IBRD countries)European UnionFaroe IslandsFijiFinlandFragile and conflict affected situationsFranceFrench PolynesiaGabonGambia, TheGeorgiaGermanyGhanaGibraltarGreeceGreenlandGrenadaGuamGuatemalaGuineaGuinea-BissauGuyanaHaitiHeavily indebted poor countries (HIPC)High incomeHondurasHong Kong SAR, ChinaHungaryIBRD onlyIcelandIDA & IBRD totalIDA blendIDA onlyIDA totalIndiaIndonesiaIran, Islamic Rep.IraqIrelandIsle of ManIsraelItalyJamaicaJapanJordanKazakhstanKenyaKiribatiKorea, Dem. People’s Rep.Korea, Rep.KosovoKuwaitKyrgyz RepublicLao PDRLate-demographic dividendLatin America & Caribbean Latin America & Caribbean (excluding high income)Latin America & the Caribbean (IDA & IBRD countries)LatviaLeast developed countries: UN classificationLebanonLesothoLiberiaLibyaLiechtensteinLithuaniaLow & middle incomeLow incomeLower middle incomeLuxembourgMacao SAR, ChinaMacedonia, FYRMadagascarMalawiMalaysiaMaldivesMaliMaltaMarshall IslandsMauritaniaMauritiusMexicoMicronesia, Fed. Sts.Middle East & North AfricaMiddle East & North Africa (excluding high income)Middle East & North Africa (IDA & IBRD countries)Middle incomeMoldovaMonacoMongoliaMontenegroMoroccoMozambiqueMyanmarNamibiaNauruNepalNetherlandsNew CaledoniaNew ZealandNicaraguaNigerNigeriaNorth AmericaNorthern Mariana IslandsNorwayOECD membersOmanOther small statesPacific island small statesPakistanPalauPanamaPapua New GuineaParaguayPeruPhilippinesPolandPortugalPost-demographic dividendPre-demographic dividendPuerto RicoQatarRomaniaRussian FederationRwandaSamoaSan MarinoSao Tome and PrincipeSaudi ArabiaSenegalSerbiaSeychellesSierra LeoneSingaporeSint Maarten (Dutch part)Slovak RepublicSloveniaSmall statesSolomon IslandsSomaliaSouth AfricaSouth AsiaSouth Asia (IDA & IBRD)South SudanSpainSri LankaSt. Kitts and NevisSt. LuciaSt. Martin (French part)St. Vincent and the GrenadinesSub-Saharan Africa Sub-Saharan Africa (excluding high income)Sub-Saharan Africa (IDA & IBRD countries)SudanSurinameSwazilandSwedenSwitzerlandSyrian Arab RepublicTajikistanTanzaniaThailandTimor-LesteTogoTongaTrinidad and TobagoTunisiaTurkeyTurkmenistanTurks and Caicos IslandsTuvaluUgandaUkraineUnited Arab EmiratesUnited KingdomUnited StatesUpper middle incomeUruguayUzbekistanVanuatuVenezuela, RBVietnamVirgin Islands (U.S.)West Bank and GazaWorldYemen, Rep.ZambiaZimbabwe Timeline:
This timeline shows a graph from 1961 to 2016 of Venezuela, RB. No data until 1960. Number of actual observations by date: 56.
Source name:
World Development Indicators
Source organization:
Derived from total population. Population source: (1) United Nations Population Division. World Population Prospects, (2) United Nations Statistical Division. Population and Vital Statistics Report (various years), (3) Census reports and other statistical
Categories, topics:
Climate Change, Health
Last updated:
apr 23, 2017
Indicators value changes by year
At the date of observation
Value
Absolute change
Change from previous value
jan 1, 1961
3.751
+3.751
0.0%
jan 1, 1962
3.792
+0.041
1.1%
jan 1, 1963
3.813
+0.022
0.57%
jan 1, 1964
3.792
-0.021
-0.56%
jan 1, 1965
3.719
-0.074
-1.94%
jan 1, 1966
3.611
-0.108
-2.89%
jan 1, 1967
3.505
-0.106
-2.94%
jan 1, 1968
3.41
-0.095
-2.72%
jan 1, 1969
3.307
-0.103
-3.02%
jan 1, 1970
3.197
-0.11
-3.32%
jan 1, 1971
3.087
-0.11
-3.43%
jan 1, 1972
2.976
-0.111
-3.6%
jan 1, 1973
2.879
-0.098
-3.28%
jan 1, 1974
2.813
-0.065
-2.27%
jan 1, 1975
2.786
-0.027
-0.95%
jan 1, 1976
2.785
-0.001
-0.05%
jan 1, 1977
2.791
+0.006
0.22%
jan 1, 1978
2.789
-0.001
-0.05%
jan 1, 1979
2.779
-0.01
-0.37%
jan 1, 1980
2.755
-0.024
-0.85%
jan 1, 1981
2.723
-0.032
-1.18%
jan 1, 1982
2.687
-0.036
-1.32%
jan 1, 1983
2.655
-0.032
-1.19%
jan 1, 1984
2.631
-0.024
-0.92%
jan 1, 1985
2.616
-0.015
-0.56%
jan 1, 1986
2.605
-0.011
-0.4%
jan 1, 1987
2.596
-0.009
-0.36%
jan 1, 1988
2.578
-0.018
-0.7%
jan 1, 1989
2.542
-0.036
-1.39%
jan 1, 1990
2.485
-0.057
-2.25%
jan 1, 1991
2.414
-0.071
-2.86%
jan 1, 1992
2.34
-0.074
-3.05%
jan 1, 1993
2.272
-0.068
-2.92%
jan 1, 1994
2.209
-0.063
-2.78%
jan 1, 1995
2.153
-0.056
-2.52%
jan 1, 1996
2.103
-0.05
-2.31%
jan 1, 1997
2.054
-0.049
-2.34%
jan 1, 1998
2.005
-0.049
-2.38%
jan 1, 1999
1.961
-0.044
-2.19%
jan 1, 2000
1.923
-0.038
-1.95%
jan 1, 2001
1.889
-0.034
-1.78%
jan 1, 2002
1.857
-0.033
-1.72%
jan 1, 2003
1.823
-0.033
-1.79%
jan 1, 2004
1.789
-0.035
-1.9%
jan 1, 2005
1.752
-0.037
-2.07%
jan 1, 2006
1.713
-0.039
-2.21%
jan 1, 2007
1.675
-0.038
-2.22%
jan 1, 2008
1.638
-0.037
-2.23%
jan 1, 2009
1.599
-0.038
-2.34%
jan 1, 2010
1.559
-0.04
-2.49%
jan 1, 2011
1.519
-0.04
-2.59%
jan 1, 2012
1.478
-0.041
-2.67%
jan 1, 2013
1.439
-0.039
-2.65%
jan 1, 2014
1.403
-0.036
-2.52%
jan 1, 2015
1.37
-0.033
-2.32%
jan 1, 2016
1.341
-0.03
-2.18%
Ranking of countries by current statistics by years


Comments: