29
/
en
AIzaSyAYiBZKx7MnpbEhh9jyipgxe19OcubqV5w
April 1, 2024
209680
New Zealand
NZL
true
2
1
Population growth (annual %)
2016,2015,2014,2013,2012,2011,2010,2009,2008,2007,2006,2005,2004,2003,2002,2001,2000,1999,1998,1997,1996,1995,1994,1993,1991,1990,1989,1988,1987,1986,1985,1984,1983,1982,1981,1980,1979,1978,1977,1976,1975,1974,1973,1972,1971,1970,1969,1968,1967,1966,1965,1964,1963,1962,1961
This statistics in other country:
AfghanistanAlbaniaAlgeriaAmerican SamoaAndorraAngolaAntigua and BarbudaArab WorldArgentinaArmeniaArubaAustraliaAustriaAzerbaijanBahamas, TheBahrainBangladeshBarbadosBelarusBelgiumBelizeBeninBermudaBhutanBoliviaBosnia and HerzegovinaBotswanaBrazilBritish Virgin IslandsBrunei DarussalamBulgariaBurkina FasoBurundiCabo VerdeCambodiaCameroonCanadaCaribbean small statesCayman IslandsCentral African RepublicCentral Europe and the BalticsChadChannel IslandsChileChinaColombiaComorosCongo, Dem. Rep.Congo, Rep.Costa RicaCote d'IvoireCroatiaCubaCuracaoCyprusCzech RepublicDenmarkDjiboutiDominicaDominican RepublicEarly-demographic dividendEast Asia & PacificEast Asia & Pacific (excluding high income)East Asia & Pacific (IDA & IBRD countries)EcuadorEgypt, Arab Rep.El SalvadorEquatorial GuineaEritreaEstoniaEthiopiaEuro areaEurope & Central AsiaEurope & Central Asia (excluding high income)Europe & Central Asia (IDA & IBRD countries)European UnionFaroe IslandsFijiFinlandFragile and conflict affected situationsFranceFrench PolynesiaGabonGambia, TheGeorgiaGermanyGhanaGibraltarGreeceGreenlandGrenadaGuamGuatemalaGuineaGuinea-BissauGuyanaHaitiHeavily indebted poor countries (HIPC)High incomeHondurasHong Kong SAR, ChinaHungaryIBRD onlyIcelandIDA & IBRD totalIDA blendIDA onlyIDA totalIndiaIndonesiaIran, Islamic Rep.IraqIrelandIsle of ManIsraelItalyJamaicaJapanJordanKazakhstanKenyaKiribatiKorea, Dem. People’s Rep.Korea, Rep.KosovoKuwaitKyrgyz RepublicLao PDRLate-demographic dividendLatin America & Caribbean Latin America & Caribbean (excluding high income)Latin America & the Caribbean (IDA & IBRD countries)LatviaLeast developed countries: UN classificationLebanonLesothoLiberiaLibyaLiechtensteinLithuaniaLow & middle incomeLow incomeLower middle incomeLuxembourgMacao SAR, ChinaMacedonia, FYRMadagascarMalawiMalaysiaMaldivesMaliMaltaMarshall IslandsMauritaniaMauritiusMexicoMicronesia, Fed. Sts.Middle East & North AfricaMiddle East & North Africa (excluding high income)Middle East & North Africa (IDA & IBRD countries)Middle incomeMoldovaMonacoMongoliaMontenegroMoroccoMozambiqueMyanmarNamibiaNauruNepalNetherlandsNew CaledoniaNew ZealandNicaraguaNigerNigeriaNorth AmericaNorthern Mariana IslandsNorwayOECD membersOmanOther small statesPacific island small statesPakistanPalauPanamaPapua New GuineaParaguayPeruPhilippinesPolandPortugalPost-demographic dividendPre-demographic dividendPuerto RicoQatarRomaniaRussian FederationRwandaSamoaSan MarinoSao Tome and PrincipeSaudi ArabiaSenegalSerbiaSeychellesSierra LeoneSingaporeSint Maarten (Dutch part)Slovak RepublicSloveniaSmall statesSolomon IslandsSomaliaSouth AfricaSouth AsiaSouth Asia (IDA & IBRD)South SudanSpainSri LankaSt. Kitts and NevisSt. LuciaSt. Martin (French part)St. Vincent and the GrenadinesSub-Saharan Africa Sub-Saharan Africa (excluding high income)Sub-Saharan Africa (IDA & IBRD countries)SudanSurinameSwazilandSwedenSwitzerlandSyrian Arab RepublicTajikistanTanzaniaThailandTimor-LesteTogoTongaTrinidad and TobagoTunisiaTurkeyTurkmenistanTurks and Caicos IslandsTuvaluUgandaUkraineUnited Arab EmiratesUnited KingdomUnited StatesUpper middle incomeUruguayUzbekistanVanuatuVenezuela, RBVietnamVirgin Islands (U.S.)West Bank and GazaWorldYemen, Rep.ZambiaZimbabwe Timeline:
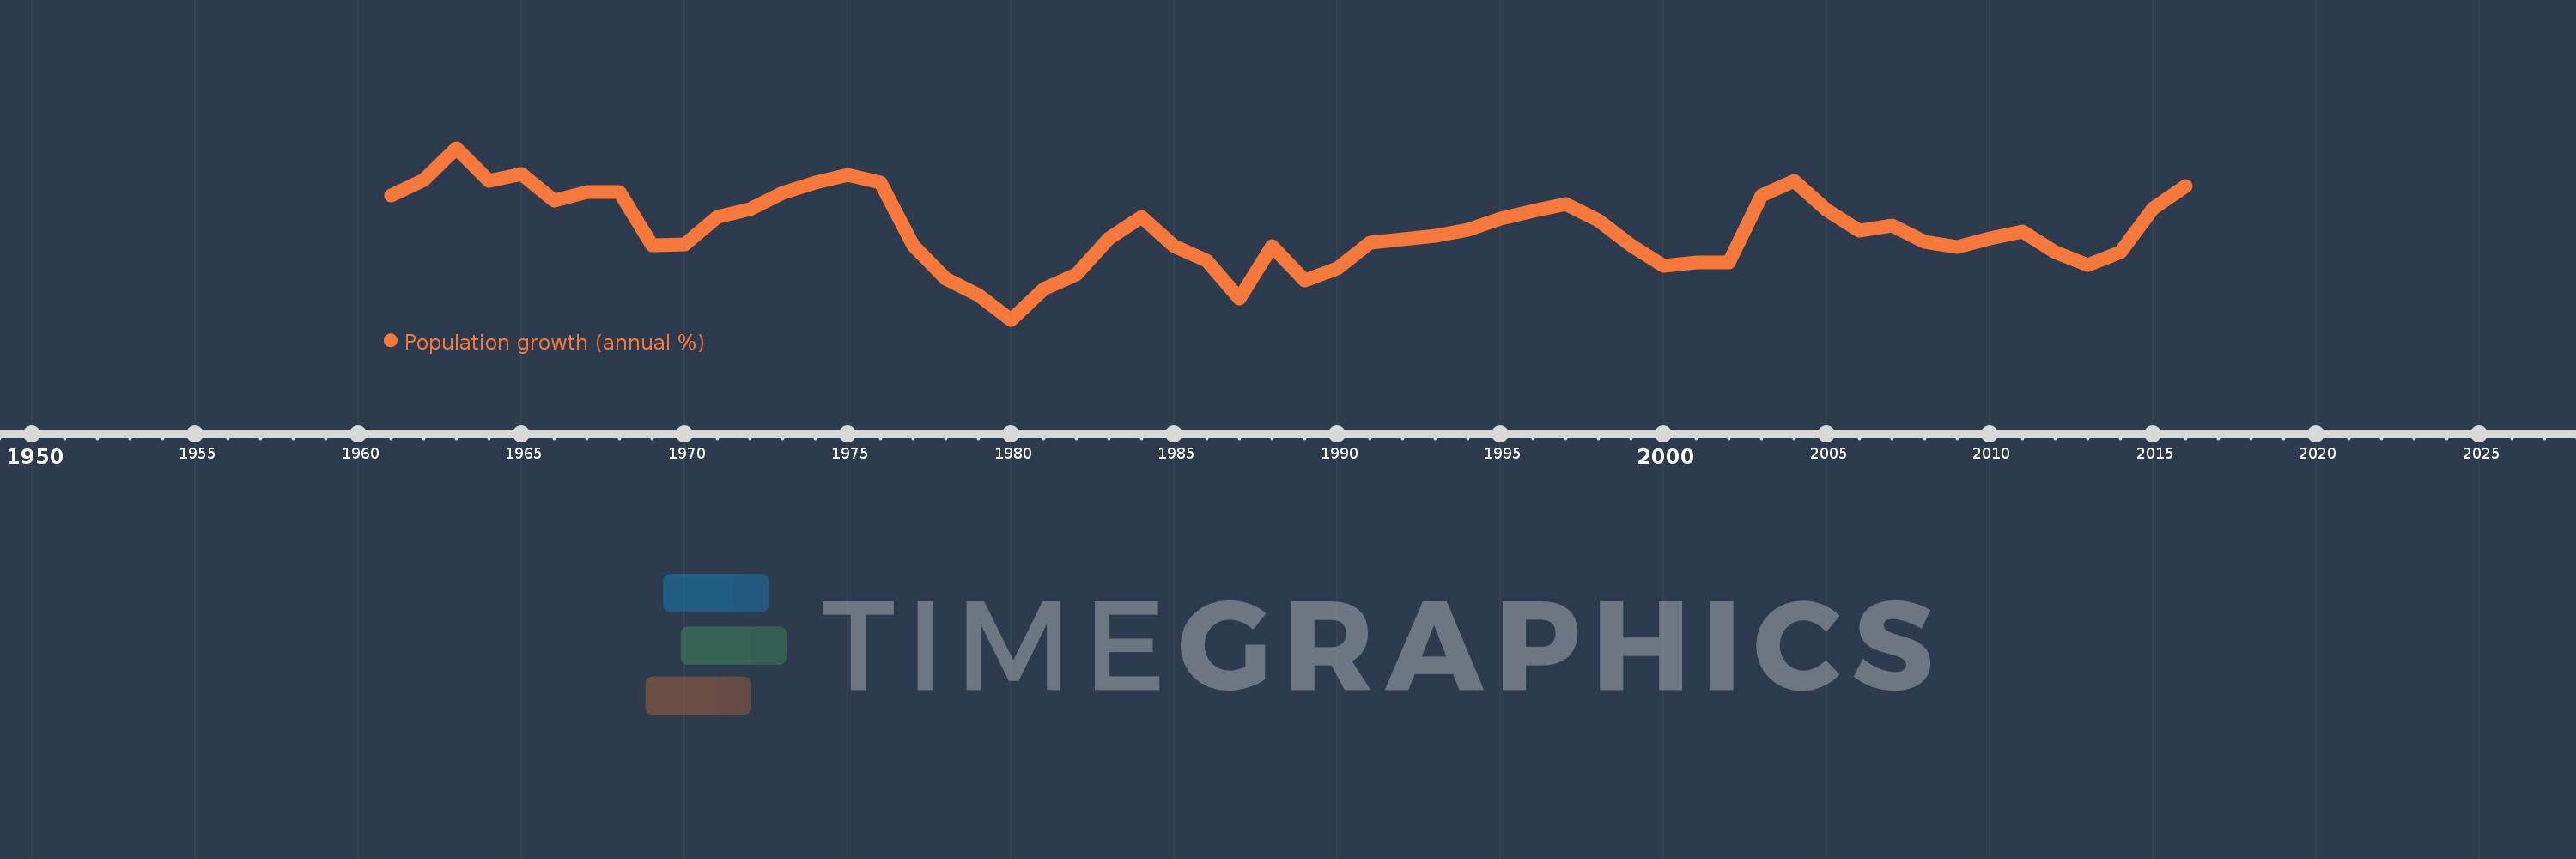
This timeline shows a graph from 1961 to 2016 of New Zealand. No data until 1960. Number of actual observations by date: 55.
Source name:
World Development Indicators
Source organization:
Derived from total population. Population source: (1) United Nations Population Division. World Population Prospects, (2) United Nations Statistical Division. Population and Vital Statistics Report (various years), (3) Census reports and other statistical
Categories, topics:
Climate Change, Health
Last updated:
apr 23, 2017
Indicators value changes by year
Minimum:
-0.392
jan 1, 1980
At the date of observation
Value
Absolute change
Change from previous value
jan 1, 1961
1.731
+1.731
0.0%
jan 1, 1962
1.999
+0.269
15.52%
jan 1, 1963
2.542
+0.543
27.14%
jan 1, 1964
1.987
-0.556
-21.85%
jan 1, 1965
2.095
+0.108
5.46%
jan 1, 1966
1.65
-0.445
-21.26%
jan 1, 1967
1.791
+0.142
8.58%
jan 1, 1968
1.785
-0.006
-0.32%
jan 1, 1969
0.877
-0.908
-50.87%
jan 1, 1970
0.895
+0.018
2.01%
jan 1, 1971
1.358
+0.463
51.72%
jan 1, 1972
1.494
+0.136
10.03%
jan 1, 1973
1.768
+0.275
18.38%
jan 1, 1974
1.957
+0.189
10.69%
jan 1, 1975
2.085
+0.128
6.54%
jan 1, 1976
1.945
-0.14
-6.71%
jan 1, 1977
0.885
-1.061
-54.52%
jan 1, 1978
0.311
-0.573
-64.81%
jan 1, 1979
0.032
-0.279
-89.71%
jan 1, 1980
-0.392
-0.424
-1.32K%
jan 1, 1981
0.125
+0.517
-132.01%
jan 1, 1982
0.385
+0.259
206.91%
jan 1, 1983
0.993
+0.609
158.21%
jan 1, 1984
1.359
+0.366
36.84%
jan 1, 1985
0.865
-0.494
-36.36%
jan 1, 1986
0.618
-0.247
-28.59%
jan 1, 1987
-0.025
-0.642
-103.99%
jan 1, 1988
0.862
+0.887
-3.6K%
jan 1, 1989
0.274
-0.587
-68.15%
jan 1, 1990
0.48
+0.206
74.89%
jan 1, 1991
0.923
+0.443
92.32%
jan 1, 1993
1.042
+0.119
12.84%
jan 1, 1994
1.14
+0.098
9.45%
jan 1, 1995
1.329
+0.189
16.58%
jan 1, 1996
1.464
+0.135
10.17%
jan 1, 1997
1.583
+0.118
8.08%
jan 1, 1998
1.312
-0.27
-17.08%
jan 1, 1999
0.887
-0.425
-32.39%
jan 1, 2000
0.525
-0.362
-40.78%
jan 1, 2001
0.588
+0.062
11.81%
jan 1, 2002
0.589
+0.002
0.29%
jan 1, 2003
1.737
+1.148
194.79%
jan 1, 2004
1.974
+0.236
13.61%
jan 1, 2005
1.486
-0.487
-24.69%
jan 1, 2006
1.129
-0.357
-24.05%
jan 1, 2007
1.219
+0.09
7.99%
jan 1, 2008
0.932
-0.287
-23.51%
jan 1, 2009
0.849
-0.084
-8.98%
jan 1, 2010
1.0
+0.151
17.8%
jan 1, 2011
1.112
+0.112
11.2%
jan 1, 2012
0.762
-0.349
-31.41%
jan 1, 2013
0.548
-0.214
-28.1%
jan 1, 2014
0.768
+0.22
40.15%
jan 1, 2015
1.51
+0.742
96.57%
jan 1, 2016
1.889
+0.379
25.07%
Ranking of countries by current statistics by years


Comments: