29
/
en
AIzaSyAYiBZKx7MnpbEhh9jyipgxe19OcubqV5w
April 1, 2024
69173
Antigua and Barbuda
ATG
true
2
1
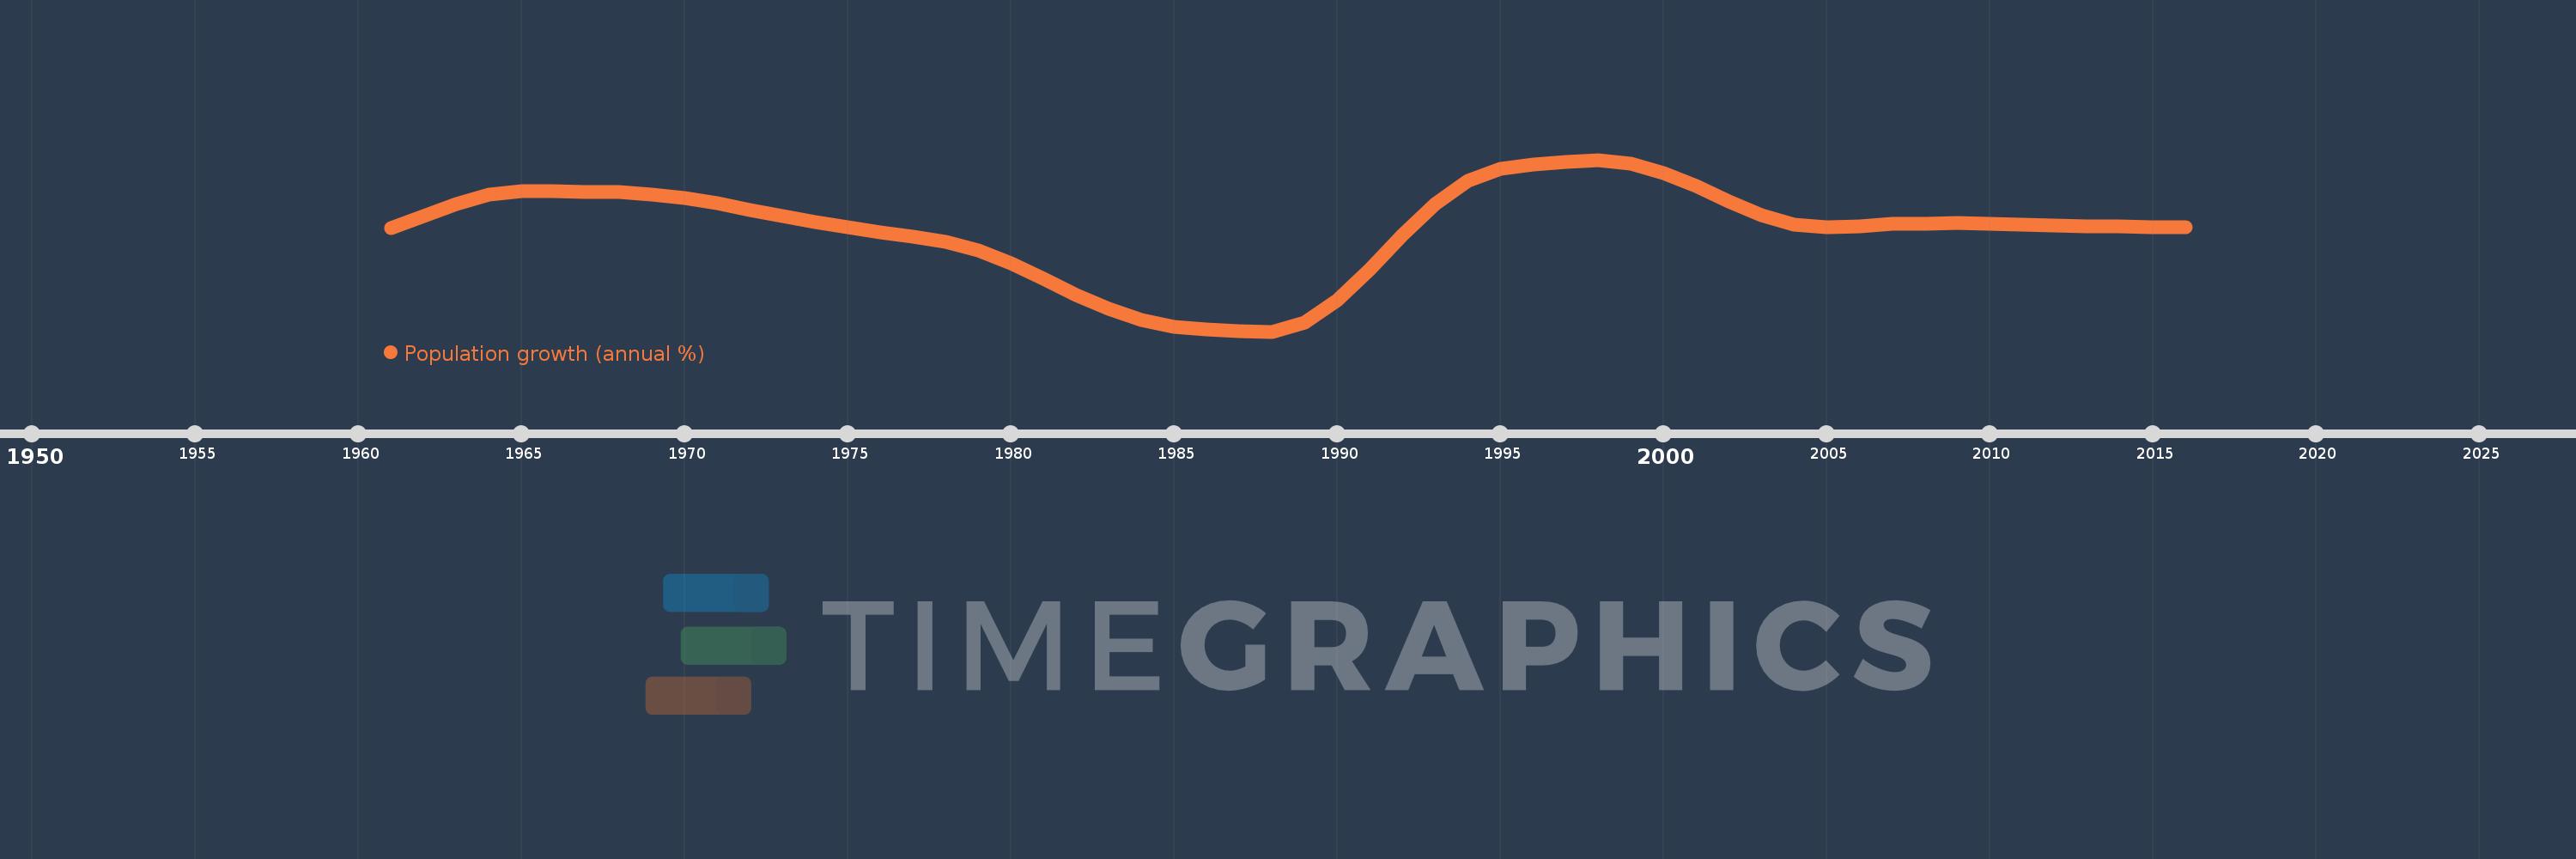
Population growth (annual %)
2016,2015,2014,2013,2012,2011,2010,2009,2008,2007,2006,2005,2004,2003,2002,2001,2000,1999,1998,1997,1996,1995,1994,1993,1992,1991,1990,1989,1988,1987,1986,1985,1984,1983,1982,1981,1980,1979,1978,1977,1976,1975,1974,1973,1972,1971,1970,1969,1968,1967,1966,1965,1964,1963,1962,1961
This statistics in other country:
AfghanistanAlbaniaAlgeriaAmerican SamoaAndorraAngolaAntigua and BarbudaArab WorldArgentinaArmeniaArubaAustraliaAustriaAzerbaijanBahamas, TheBahrainBangladeshBarbadosBelarusBelgiumBelizeBeninBermudaBhutanBoliviaBosnia and HerzegovinaBotswanaBrazilBritish Virgin IslandsBrunei DarussalamBulgariaBurkina FasoBurundiCabo VerdeCambodiaCameroonCanadaCaribbean small statesCayman IslandsCentral African RepublicCentral Europe and the BalticsChadChannel IslandsChileChinaColombiaComorosCongo, Dem. Rep.Congo, Rep.Costa RicaCote d'IvoireCroatiaCubaCuracaoCyprusCzech RepublicDenmarkDjiboutiDominicaDominican RepublicEarly-demographic dividendEast Asia & PacificEast Asia & Pacific (excluding high income)East Asia & Pacific (IDA & IBRD countries)EcuadorEgypt, Arab Rep.El SalvadorEquatorial GuineaEritreaEstoniaEthiopiaEuro areaEurope & Central AsiaEurope & Central Asia (excluding high income)Europe & Central Asia (IDA & IBRD countries)European UnionFaroe IslandsFijiFinlandFragile and conflict affected situationsFranceFrench PolynesiaGabonGambia, TheGeorgiaGermanyGhanaGibraltarGreeceGreenlandGrenadaGuamGuatemalaGuineaGuinea-BissauGuyanaHaitiHeavily indebted poor countries (HIPC)High incomeHondurasHong Kong SAR, ChinaHungaryIBRD onlyIcelandIDA & IBRD totalIDA blendIDA onlyIDA totalIndiaIndonesiaIran, Islamic Rep.IraqIrelandIsle of ManIsraelItalyJamaicaJapanJordanKazakhstanKenyaKiribatiKorea, Dem. People’s Rep.Korea, Rep.KosovoKuwaitKyrgyz RepublicLao PDRLate-demographic dividendLatin America & Caribbean Latin America & Caribbean (excluding high income)Latin America & the Caribbean (IDA & IBRD countries)LatviaLeast developed countries: UN classificationLebanonLesothoLiberiaLibyaLiechtensteinLithuaniaLow & middle incomeLow incomeLower middle incomeLuxembourgMacao SAR, ChinaMacedonia, FYRMadagascarMalawiMalaysiaMaldivesMaliMaltaMarshall IslandsMauritaniaMauritiusMexicoMicronesia, Fed. Sts.Middle East & North AfricaMiddle East & North Africa (excluding high income)Middle East & North Africa (IDA & IBRD countries)Middle incomeMoldovaMonacoMongoliaMontenegroMoroccoMozambiqueMyanmarNamibiaNauruNepalNetherlandsNew CaledoniaNew ZealandNicaraguaNigerNigeriaNorth AmericaNorthern Mariana IslandsNorwayOECD membersOmanOther small statesPacific island small statesPakistanPalauPanamaPapua New GuineaParaguayPeruPhilippinesPolandPortugalPost-demographic dividendPre-demographic dividendPuerto RicoQatarRomaniaRussian FederationRwandaSamoaSan MarinoSao Tome and PrincipeSaudi ArabiaSenegalSerbiaSeychellesSierra LeoneSingaporeSint Maarten (Dutch part)Slovak RepublicSloveniaSmall statesSolomon IslandsSomaliaSouth AfricaSouth AsiaSouth Asia (IDA & IBRD)South SudanSpainSri LankaSt. Kitts and NevisSt. LuciaSt. Martin (French part)St. Vincent and the GrenadinesSub-Saharan Africa Sub-Saharan Africa (excluding high income)Sub-Saharan Africa (IDA & IBRD countries)SudanSurinameSwazilandSwedenSwitzerlandSyrian Arab RepublicTajikistanTanzaniaThailandTimor-LesteTogoTongaTrinidad and TobagoTunisiaTurkeyTurkmenistanTurks and Caicos IslandsTuvaluUgandaUkraineUnited Arab EmiratesUnited KingdomUnited StatesUpper middle incomeUruguayUzbekistanVanuatuVenezuela, RBVietnamVirgin Islands (U.S.)West Bank and GazaWorldYemen, Rep.ZambiaZimbabwe Timeline:
This timeline shows a graph from 1961 to 2016 of Antigua and Barbuda. No data until 1960. Number of actual observations by date: 56.
Source name:
World Development Indicators
Source organization:
Derived from total population. Population source: (1) United Nations Population Division. World Population Prospects, (2) United Nations Statistical Division. Population and Vital Statistics Report (various years), (3) Census reports and other statistical
Categories, topics:
Climate Change, Health
Last updated:
apr 23, 2017
Indicators value changes by year
At the date of observation
Value
Absolute change
Change from previous value
jan 1, 1961
0.989
+0.989
0.0%
jan 1, 1962
1.312
+0.323
32.67%
jan 1, 1963
1.626
+0.314
23.93%
jan 1, 1964
1.86
+0.234
14.4%
jan 1, 1965
1.954
+0.094
5.07%
jan 1, 1966
1.952
-0.002
-0.11%
jan 1, 1967
1.934
-0.018
-0.9%
jan 1, 1968
1.928
-0.006
-0.31%
jan 1, 1969
1.876
-0.052
-2.71%
jan 1, 1970
1.774
-0.101
-5.4%
jan 1, 1971
1.638
-0.136
-7.69%
jan 1, 1972
1.471
-0.166
-10.16%
jan 1, 1973
1.298
-0.173
-11.76%
jan 1, 1974
1.135
-0.164
-12.6%
jan 1, 1975
1.0
-0.135
-11.9%
jan 1, 1976
0.867
-0.133
-13.26%
jan 1, 1977
0.761
-0.106
-12.26%
jan 1, 1978
0.63
-0.131
-17.21%
jan 1, 1979
0.405
-0.225
-35.71%
jan 1, 1980
0.064
-0.341
-84.25%
jan 1, 1981
-0.358
-0.422
-660.82%
jan 1, 1982
-0.787
-0.429
119.91%
jan 1, 1983
-1.154
-0.367
46.61%
jan 1, 1984
-1.449
-0.296
25.62%
jan 1, 1985
-1.624
-0.175
12.09%
jan 1, 1986
-1.688
-0.063
3.9%
jan 1, 1987
-1.748
-0.06
3.55%
jan 1, 1988
-1.75
-0.003
0.16%
jan 1, 1989
-1.501
+0.249
-14.23%
jan 1, 1990
-0.917
+0.584
-38.91%
jan 1, 1991
-0.098
+0.819
-89.26%
jan 1, 1992
0.814
+0.913
-926.54%
jan 1, 1993
1.624
+0.81
99.53%
jan 1, 1994
2.235
+0.611
37.63%
jan 1, 1995
2.56
+0.324
14.51%
jan 1, 1996
2.667
+0.107
4.2%
jan 1, 1997
2.736
+0.069
2.58%
jan 1, 1998
2.789
+0.053
1.94%
jan 1, 1999
2.696
-0.093
-3.34%
jan 1, 2000
2.443
-0.253
-9.4%
jan 1, 2001
2.091
-0.351
-14.39%
jan 1, 2002
1.691
-0.401
-19.15%
jan 1, 2003
1.331
-0.36
-21.29%
jan 1, 2004
1.086
-0.245
-18.38%
jan 1, 2005
1.001
-0.085
-7.83%
jan 1, 2006
1.031
+0.03
3.0%
jan 1, 2007
1.087
+0.055
5.37%
jan 1, 2008
1.108
+0.022
1.98%
jan 1, 2009
1.123
+0.015
1.34%
jan 1, 2010
1.107
-0.016
-1.42%
jan 1, 2011
1.075
-0.032
-2.86%
jan 1, 2012
1.048
-0.027
-2.54%
jan 1, 2013
1.035
-0.013
-1.25%
jan 1, 2014
1.023
-0.012
-1.13%
jan 1, 2015
1.012
-0.011
-1.12%
jan 1, 2016
1.005
-0.007
-0.68%
Ranking of countries by current statistics by years


Comments: