29
/
en
AIzaSyAYiBZKx7MnpbEhh9jyipgxe19OcubqV5w
April 1, 2024
57477
South Asia
SAS
false
2
1
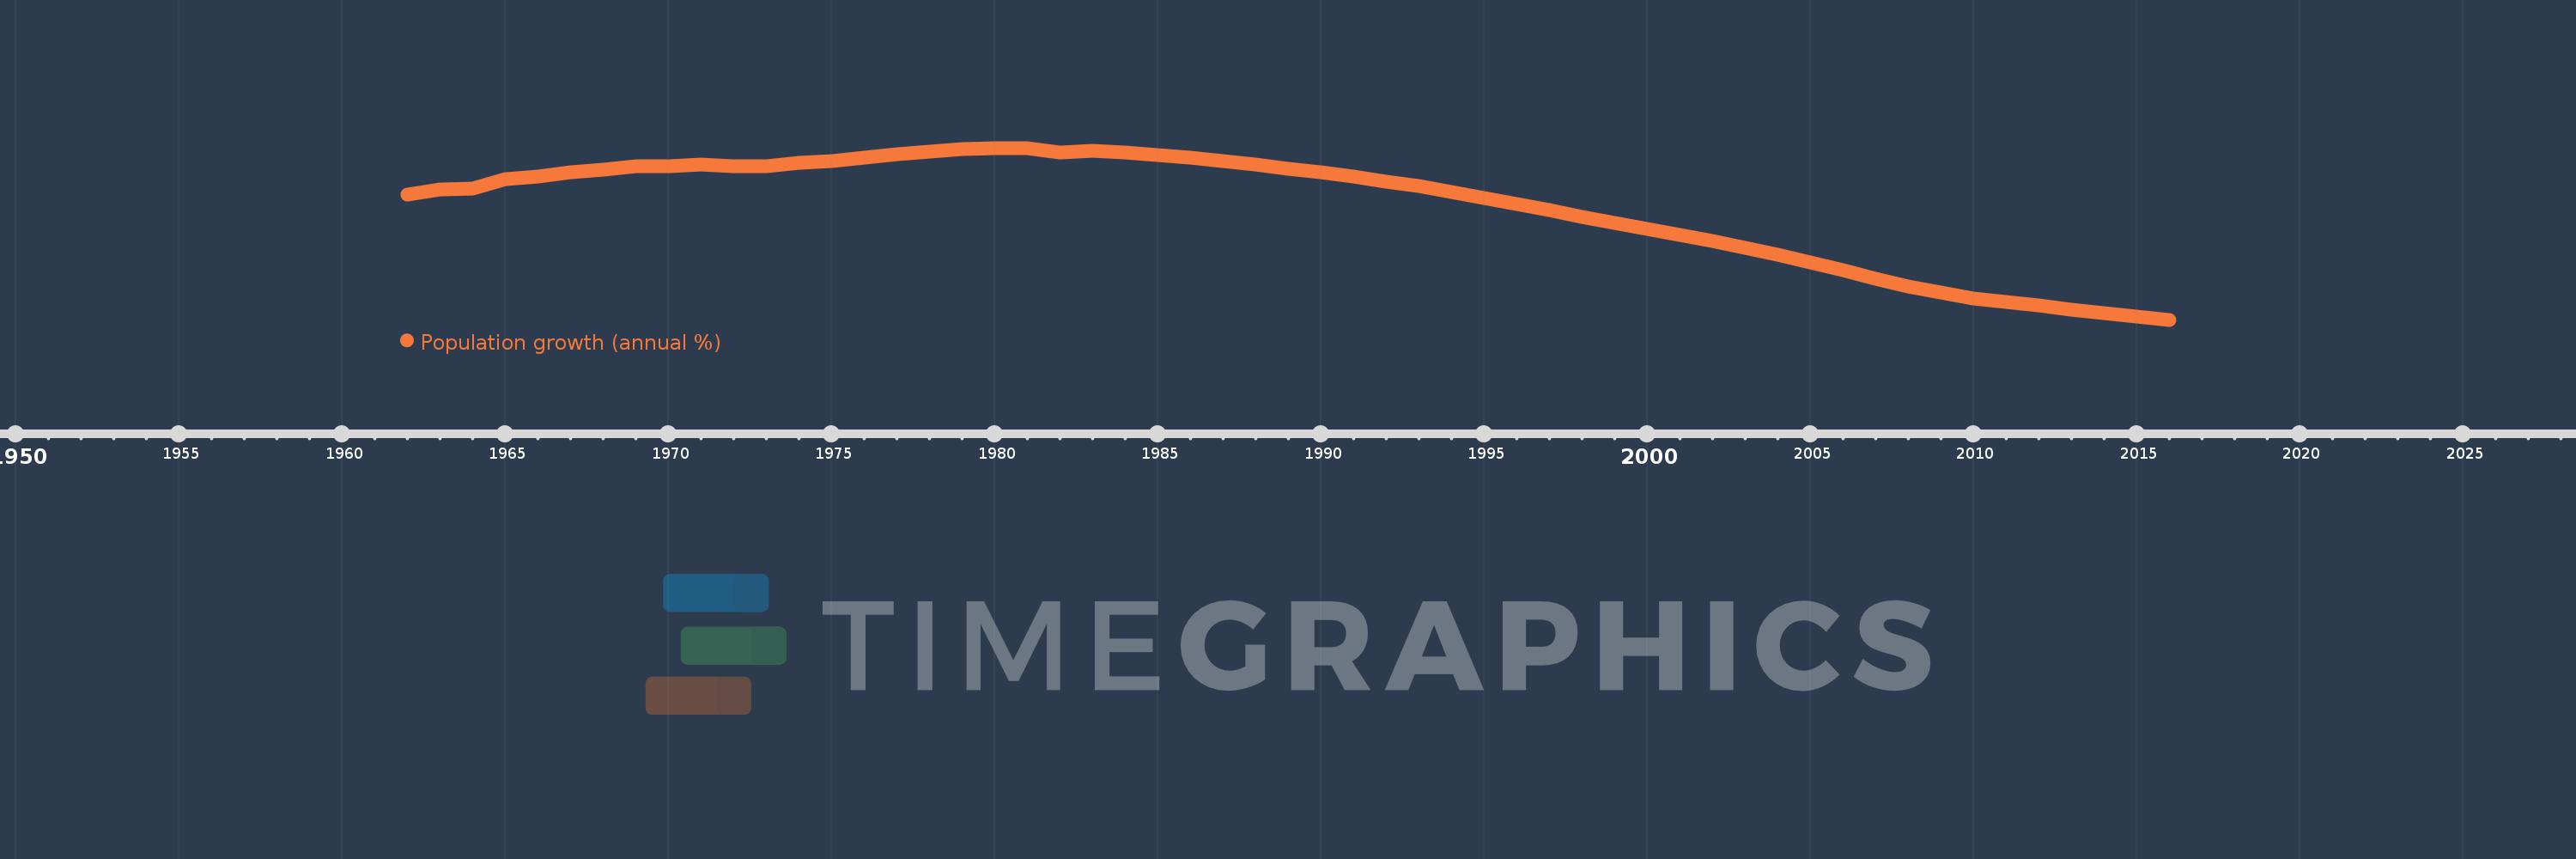
Population growth (annual %)
2016,2015,2014,2013,2012,2011,2010,2009,2008,2007,2006,2005,2004,2003,2002,2001,2000,1999,1998,1997,1996,1995,1994,1993,1992,1991,1990,1989,1988,1987,1986,1985,1984,1983,1982,1981,1980,1979,1978,1977,1976,1975,1974,1973,1972,1971,1970,1969,1968,1967,1966,1965,1964,1963,1962
This statistics in other country:
AfghanistanAlbaniaAlgeriaAmerican SamoaAndorraAngolaAntigua and BarbudaArab WorldArgentinaArmeniaArubaAustraliaAustriaAzerbaijanBahamas, TheBahrainBangladeshBarbadosBelarusBelgiumBelizeBeninBermudaBhutanBoliviaBosnia and HerzegovinaBotswanaBrazilBritish Virgin IslandsBrunei DarussalamBulgariaBurkina FasoBurundiCabo VerdeCambodiaCameroonCanadaCaribbean small statesCayman IslandsCentral African RepublicCentral Europe and the BalticsChadChannel IslandsChileChinaColombiaComorosCongo, Dem. Rep.Congo, Rep.Costa RicaCote d'IvoireCroatiaCubaCuracaoCyprusCzech RepublicDenmarkDjiboutiDominicaDominican RepublicEarly-demographic dividendEast Asia & PacificEast Asia & Pacific (excluding high income)East Asia & Pacific (IDA & IBRD countries)EcuadorEgypt, Arab Rep.El SalvadorEquatorial GuineaEritreaEstoniaEthiopiaEuro areaEurope & Central AsiaEurope & Central Asia (excluding high income)Europe & Central Asia (IDA & IBRD countries)European UnionFaroe IslandsFijiFinlandFragile and conflict affected situationsFranceFrench PolynesiaGabonGambia, TheGeorgiaGermanyGhanaGibraltarGreeceGreenlandGrenadaGuamGuatemalaGuineaGuinea-BissauGuyanaHaitiHeavily indebted poor countries (HIPC)High incomeHondurasHong Kong SAR, ChinaHungaryIBRD onlyIcelandIDA & IBRD totalIDA blendIDA onlyIDA totalIndiaIndonesiaIran, Islamic Rep.IraqIrelandIsle of ManIsraelItalyJamaicaJapanJordanKazakhstanKenyaKiribatiKorea, Dem. People’s Rep.Korea, Rep.KosovoKuwaitKyrgyz RepublicLao PDRLate-demographic dividendLatin America & Caribbean Latin America & Caribbean (excluding high income)Latin America & the Caribbean (IDA & IBRD countries)LatviaLeast developed countries: UN classificationLebanonLesothoLiberiaLibyaLiechtensteinLithuaniaLow & middle incomeLow incomeLower middle incomeLuxembourgMacao SAR, ChinaMacedonia, FYRMadagascarMalawiMalaysiaMaldivesMaliMaltaMarshall IslandsMauritaniaMauritiusMexicoMicronesia, Fed. Sts.Middle East & North AfricaMiddle East & North Africa (excluding high income)Middle East & North Africa (IDA & IBRD countries)Middle incomeMoldovaMonacoMongoliaMontenegroMoroccoMozambiqueMyanmarNamibiaNauruNepalNetherlandsNew CaledoniaNew ZealandNicaraguaNigerNigeriaNorth AmericaNorthern Mariana IslandsNorwayOECD membersOmanOther small statesPacific island small statesPakistanPalauPanamaPapua New GuineaParaguayPeruPhilippinesPolandPortugalPost-demographic dividendPre-demographic dividendPuerto RicoQatarRomaniaRussian FederationRwandaSamoaSan MarinoSao Tome and PrincipeSaudi ArabiaSenegalSerbiaSeychellesSierra LeoneSingaporeSint Maarten (Dutch part)Slovak RepublicSloveniaSmall statesSolomon IslandsSomaliaSouth AfricaSouth AsiaSouth Asia (IDA & IBRD)South SudanSpainSri LankaSt. Kitts and NevisSt. LuciaSt. Martin (French part)St. Vincent and the GrenadinesSub-Saharan Africa Sub-Saharan Africa (excluding high income)Sub-Saharan Africa (IDA & IBRD countries)SudanSurinameSwazilandSwedenSwitzerlandSyrian Arab RepublicTajikistanTanzaniaThailandTimor-LesteTogoTongaTrinidad and TobagoTunisiaTurkeyTurkmenistanTurks and Caicos IslandsTuvaluUgandaUkraineUnited Arab EmiratesUnited KingdomUnited StatesUpper middle incomeUruguayUzbekistanVanuatuVenezuela, RBVietnamVirgin Islands (U.S.)West Bank and GazaWorldYemen, Rep.ZambiaZimbabwe Timeline:
This timeline shows a graph from 1962 to 2016 of South Asia. No data until 1961. Number of actual observations by date: 55.
Source name:
World Development Indicators
Source organization:
Derived from total population. Population source: (1) United Nations Population Division. World Population Prospects, (2) United Nations Statistical Division. Population and Vital Statistics Report (various years), (3) Census reports and other statistical
Categories, topics:
Climate Change, Health
Last updated:
apr 23, 2017
Indicators value changes by year
At the date of observation
Value
Absolute change
Change from previous value
jan 1, 1962
2.116
+2.116
0.0%
jan 1, 1963
2.15
+0.033
1.57%
jan 1, 1964
2.157
+0.007
0.33%
jan 1, 1965
2.215
+0.058
2.69%
jan 1, 1966
2.229
+0.014
0.65%
jan 1, 1967
2.255
+0.025
1.14%
jan 1, 1968
2.274
+0.019
0.83%
jan 1, 1969
2.293
+0.019
0.84%
jan 1, 1970
2.297
+0.005
0.21%
jan 1, 1971
2.303
+0.006
0.25%
jan 1, 1972
2.293
-0.01
-0.43%
jan 1, 1973
2.297
+0.003
0.14%
jan 1, 1974
2.314
+0.018
0.77%
jan 1, 1975
2.327
+0.012
0.54%
jan 1, 1976
2.351
+0.024
1.04%
jan 1, 1977
2.372
+0.022
0.92%
jan 1, 1978
2.388
+0.016
0.67%
jan 1, 1979
2.401
+0.013
0.54%
jan 1, 1980
2.409
+0.007
0.31%
jan 1, 1981
2.406
-0.003
-0.12%
jan 1, 1982
2.382
-0.024
-1.01%
jan 1, 1983
2.392
+0.01
0.43%
jan 1, 1984
2.38
-0.011
-0.47%
jan 1, 1985
2.366
-0.015
-0.61%
jan 1, 1986
2.348
-0.018
-0.75%
jan 1, 1987
2.328
-0.02
-0.87%
jan 1, 1988
2.305
-0.022
-0.96%
jan 1, 1989
2.281
-0.024
-1.06%
jan 1, 1990
2.255
-0.026
-1.13%
jan 1, 1991
2.228
-0.028
-1.23%
jan 1, 1992
2.2
-0.028
-1.25%
jan 1, 1993
2.169
-0.031
-1.4%
jan 1, 1994
2.136
-0.033
-1.53%
jan 1, 1995
2.099
-0.037
-1.72%
jan 1, 1996
2.061
-0.038
-1.8%
jan 1, 1997
2.021
-0.04
-1.95%
jan 1, 1998
1.98
-0.041
-2.02%
jan 1, 1999
1.941
-0.039
-1.98%
jan 1, 2000
1.902
-0.038
-1.97%
jan 1, 2001
1.864
-0.038
-2.01%
jan 1, 2002
1.828
-0.037
-1.97%
jan 1, 2003
1.788
-0.039
-2.14%
jan 1, 2004
1.745
-0.043
-2.41%
jan 1, 2005
1.697
-0.049
-2.78%
jan 1, 2006
1.646
-0.051
-3.01%
jan 1, 2007
1.594
-0.052
-3.14%
jan 1, 2008
1.546
-0.048
-3.0%
jan 1, 2009
1.505
-0.041
-2.66%
jan 1, 2010
1.472
-0.033
-2.18%
jan 1, 2011
1.448
-0.025
-1.67%
jan 1, 2012
1.424
-0.023
-1.62%
jan 1, 2013
1.4
-0.024
-1.7%
jan 1, 2014
1.378
-0.023
-1.62%
jan 1, 2015
1.358
-0.02
-1.42%
jan 1, 2016
1.337
-0.021
-1.56%
Ranking of countries by current statistics by years


Comments: