29
/
en
AIzaSyAYiBZKx7MnpbEhh9jyipgxe19OcubqV5w
April 1, 2024
134495
France
FRA
true
2
1
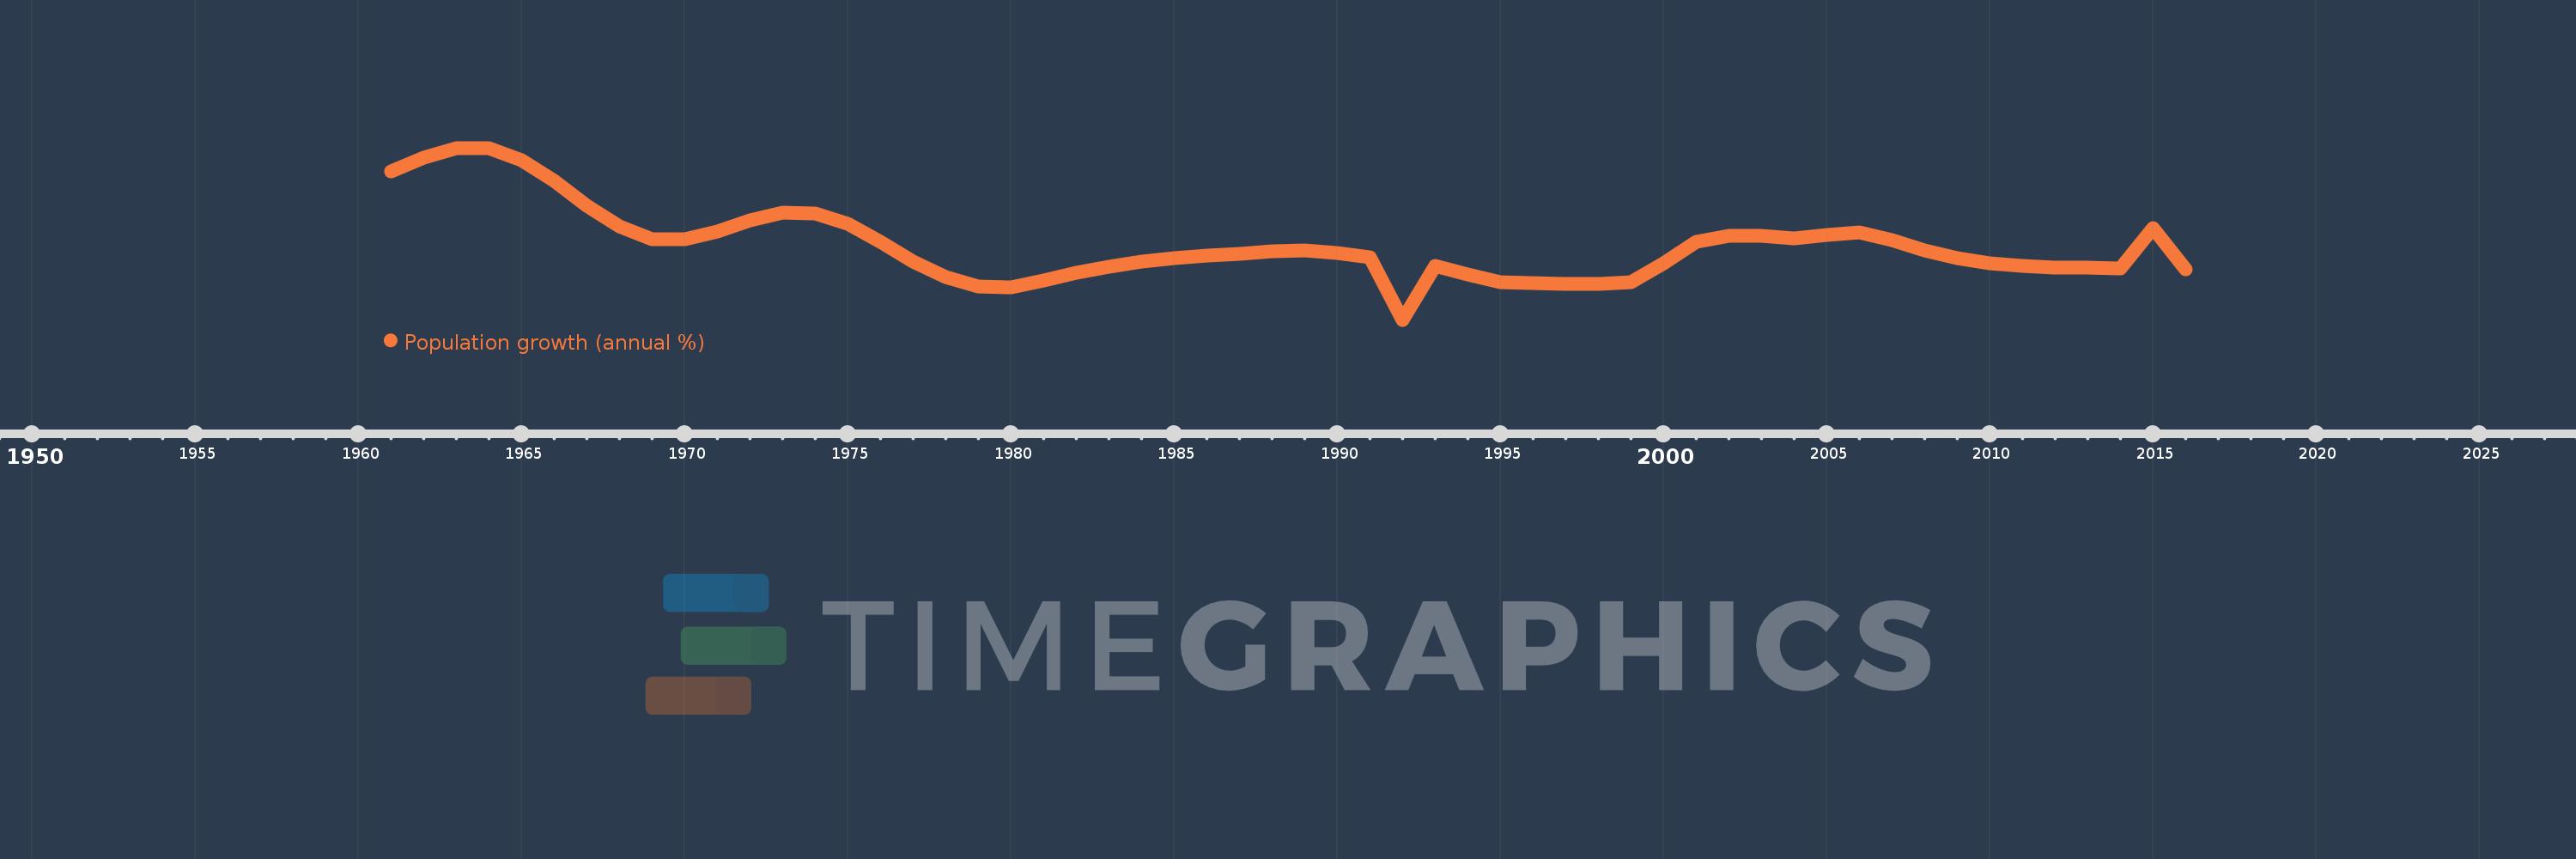
Population growth (annual %)
2016,2015,2014,2013,2012,2011,2010,2009,2008,2007,2006,2005,2004,2003,2002,2001,2000,1999,1998,1997,1996,1995,1994,1993,1992,1991,1990,1989,1988,1987,1986,1985,1984,1983,1982,1981,1980,1979,1978,1977,1976,1975,1974,1973,1972,1971,1970,1969,1968,1967,1966,1965,1964,1963,1962,1961
This statistics in other country:
AfghanistanAlbaniaAlgeriaAmerican SamoaAndorraAngolaAntigua and BarbudaArab WorldArgentinaArmeniaArubaAustraliaAustriaAzerbaijanBahamas, TheBahrainBangladeshBarbadosBelarusBelgiumBelizeBeninBermudaBhutanBoliviaBosnia and HerzegovinaBotswanaBrazilBritish Virgin IslandsBrunei DarussalamBulgariaBurkina FasoBurundiCabo VerdeCambodiaCameroonCanadaCaribbean small statesCayman IslandsCentral African RepublicCentral Europe and the BalticsChadChannel IslandsChileChinaColombiaComorosCongo, Dem. Rep.Congo, Rep.Costa RicaCote d'IvoireCroatiaCubaCuracaoCyprusCzech RepublicDenmarkDjiboutiDominicaDominican RepublicEarly-demographic dividendEast Asia & PacificEast Asia & Pacific (excluding high income)East Asia & Pacific (IDA & IBRD countries)EcuadorEgypt, Arab Rep.El SalvadorEquatorial GuineaEritreaEstoniaEthiopiaEuro areaEurope & Central AsiaEurope & Central Asia (excluding high income)Europe & Central Asia (IDA & IBRD countries)European UnionFaroe IslandsFijiFinlandFragile and conflict affected situationsFranceFrench PolynesiaGabonGambia, TheGeorgiaGermanyGhanaGibraltarGreeceGreenlandGrenadaGuamGuatemalaGuineaGuinea-BissauGuyanaHaitiHeavily indebted poor countries (HIPC)High incomeHondurasHong Kong SAR, ChinaHungaryIBRD onlyIcelandIDA & IBRD totalIDA blendIDA onlyIDA totalIndiaIndonesiaIran, Islamic Rep.IraqIrelandIsle of ManIsraelItalyJamaicaJapanJordanKazakhstanKenyaKiribatiKorea, Dem. People’s Rep.Korea, Rep.KosovoKuwaitKyrgyz RepublicLao PDRLate-demographic dividendLatin America & Caribbean Latin America & Caribbean (excluding high income)Latin America & the Caribbean (IDA & IBRD countries)LatviaLeast developed countries: UN classificationLebanonLesothoLiberiaLibyaLiechtensteinLithuaniaLow & middle incomeLow incomeLower middle incomeLuxembourgMacao SAR, ChinaMacedonia, FYRMadagascarMalawiMalaysiaMaldivesMaliMaltaMarshall IslandsMauritaniaMauritiusMexicoMicronesia, Fed. Sts.Middle East & North AfricaMiddle East & North Africa (excluding high income)Middle East & North Africa (IDA & IBRD countries)Middle incomeMoldovaMonacoMongoliaMontenegroMoroccoMozambiqueMyanmarNamibiaNauruNepalNetherlandsNew CaledoniaNew ZealandNicaraguaNigerNigeriaNorth AmericaNorthern Mariana IslandsNorwayOECD membersOmanOther small statesPacific island small statesPakistanPalauPanamaPapua New GuineaParaguayPeruPhilippinesPolandPortugalPost-demographic dividendPre-demographic dividendPuerto RicoQatarRomaniaRussian FederationRwandaSamoaSan MarinoSao Tome and PrincipeSaudi ArabiaSenegalSerbiaSeychellesSierra LeoneSingaporeSint Maarten (Dutch part)Slovak RepublicSloveniaSmall statesSolomon IslandsSomaliaSouth AfricaSouth AsiaSouth Asia (IDA & IBRD)South SudanSpainSri LankaSt. Kitts and NevisSt. LuciaSt. Martin (French part)St. Vincent and the GrenadinesSub-Saharan Africa Sub-Saharan Africa (excluding high income)Sub-Saharan Africa (IDA & IBRD countries)SudanSurinameSwazilandSwedenSwitzerlandSyrian Arab RepublicTajikistanTanzaniaThailandTimor-LesteTogoTongaTrinidad and TobagoTunisiaTurkeyTurkmenistanTurks and Caicos IslandsTuvaluUgandaUkraineUnited Arab EmiratesUnited KingdomUnited StatesUpper middle incomeUruguayUzbekistanVanuatuVenezuela, RBVietnamVirgin Islands (U.S.)West Bank and GazaWorldYemen, Rep.ZambiaZimbabwe Timeline:
This timeline shows a graph from 1961 to 2016 of France. No data until 1960. Number of actual observations by date: 56.
Source name:
World Development Indicators
Source organization:
Derived from total population. Population source: (1) United Nations Population Division. World Population Prospects, (2) United Nations Statistical Division. Population and Vital Statistics Report (various years), (3) Census reports and other statistical
Categories, topics:
Climate Change, Health
Last updated:
apr 23, 2017
Indicators value changes by year
At the date of observation
Value
Absolute change
Change from previous value
jan 1, 1961
1.23
+1.23
0.0%
jan 1, 1962
1.338
+0.108
8.8%
jan 1, 1963
1.412
+0.075
5.58%
jan 1, 1964
1.412
-0.001
-0.07%
jan 1, 1965
1.314
-0.097
-6.88%
jan 1, 1966
1.155
-0.16
-12.14%
jan 1, 1967
0.965
-0.19
-16.46%
jan 1, 1968
0.802
-0.163
-16.86%
jan 1, 1969
0.706
-0.096
-12.01%
jan 1, 1970
0.704
-0.002
-0.26%
jan 1, 1971
0.766
+0.062
8.76%
jan 1, 1972
0.852
+0.087
11.32%
jan 1, 1973
0.908
+0.056
6.58%
jan 1, 1974
0.906
-0.002
-0.23%
jan 1, 1975
0.822
-0.084
-9.27%
jan 1, 1976
0.685
-0.137
-16.72%
jan 1, 1977
0.531
-0.153
-22.42%
jan 1, 1978
0.408
-0.123
-23.19%
jan 1, 1979
0.335
-0.073
-18.0%
jan 1, 1980
0.332
-0.003
-0.82%
jan 1, 1981
0.381
+0.049
14.69%
jan 1, 1982
0.442
+0.061
16.1%
jan 1, 1983
0.49
+0.048
10.85%
jan 1, 1984
0.531
+0.042
8.48%
jan 1, 1985
0.558
+0.027
5.11%
jan 1, 1986
0.574
+0.015
2.73%
jan 1, 1987
0.592
+0.018
3.12%
jan 1, 1988
0.611
+0.019
3.2%
jan 1, 1989
0.614
+0.003
0.52%
jan 1, 1990
0.597
-0.017
-2.76%
jan 1, 1991
0.566
-0.031
-5.21%
jan 1, 1992
0.079
-0.486
-85.96%
jan 1, 1993
0.497
+0.418
525.89%
jan 1, 1994
0.433
-0.064
-12.86%
jan 1, 1995
0.372
-0.061
-14.09%
jan 1, 1996
0.361
-0.011
-2.95%
jan 1, 1997
0.354
-0.007
-1.99%
jan 1, 1998
0.354
0.0
-0.09%
jan 1, 1999
0.369
+0.015
4.2%
jan 1, 2000
0.514
+0.146
39.56%
jan 1, 2001
0.685
+0.17
33.14%
jan 1, 2002
0.728
+0.043
6.26%
jan 1, 2003
0.727
-0.001
-0.08%
jan 1, 2004
0.709
-0.018
-2.54%
jan 1, 2005
0.736
+0.028
3.89%
jan 1, 2006
0.754
+0.017
2.37%
jan 1, 2007
0.697
-0.057
-7.51%
jan 1, 2008
0.619
-0.078
-11.26%
jan 1, 2009
0.559
-0.06
-9.67%
jan 1, 2010
0.514
-0.044
-7.94%
jan 1, 2011
0.494
-0.02
-3.97%
jan 1, 2012
0.484
-0.01
-2.1%
jan 1, 2013
0.484
+0.0
0.07%
jan 1, 2014
0.475
-0.009
-1.96%
jan 1, 2015
0.791
+0.316
66.68%
jan 1, 2016
0.469
-0.322
-40.73%
Ranking of countries by current statistics by years


Comments: