29
/
en
AIzaSyAYiBZKx7MnpbEhh9jyipgxe19OcubqV5w
April 1, 2024
262769
Thailand
THA
true
2
1
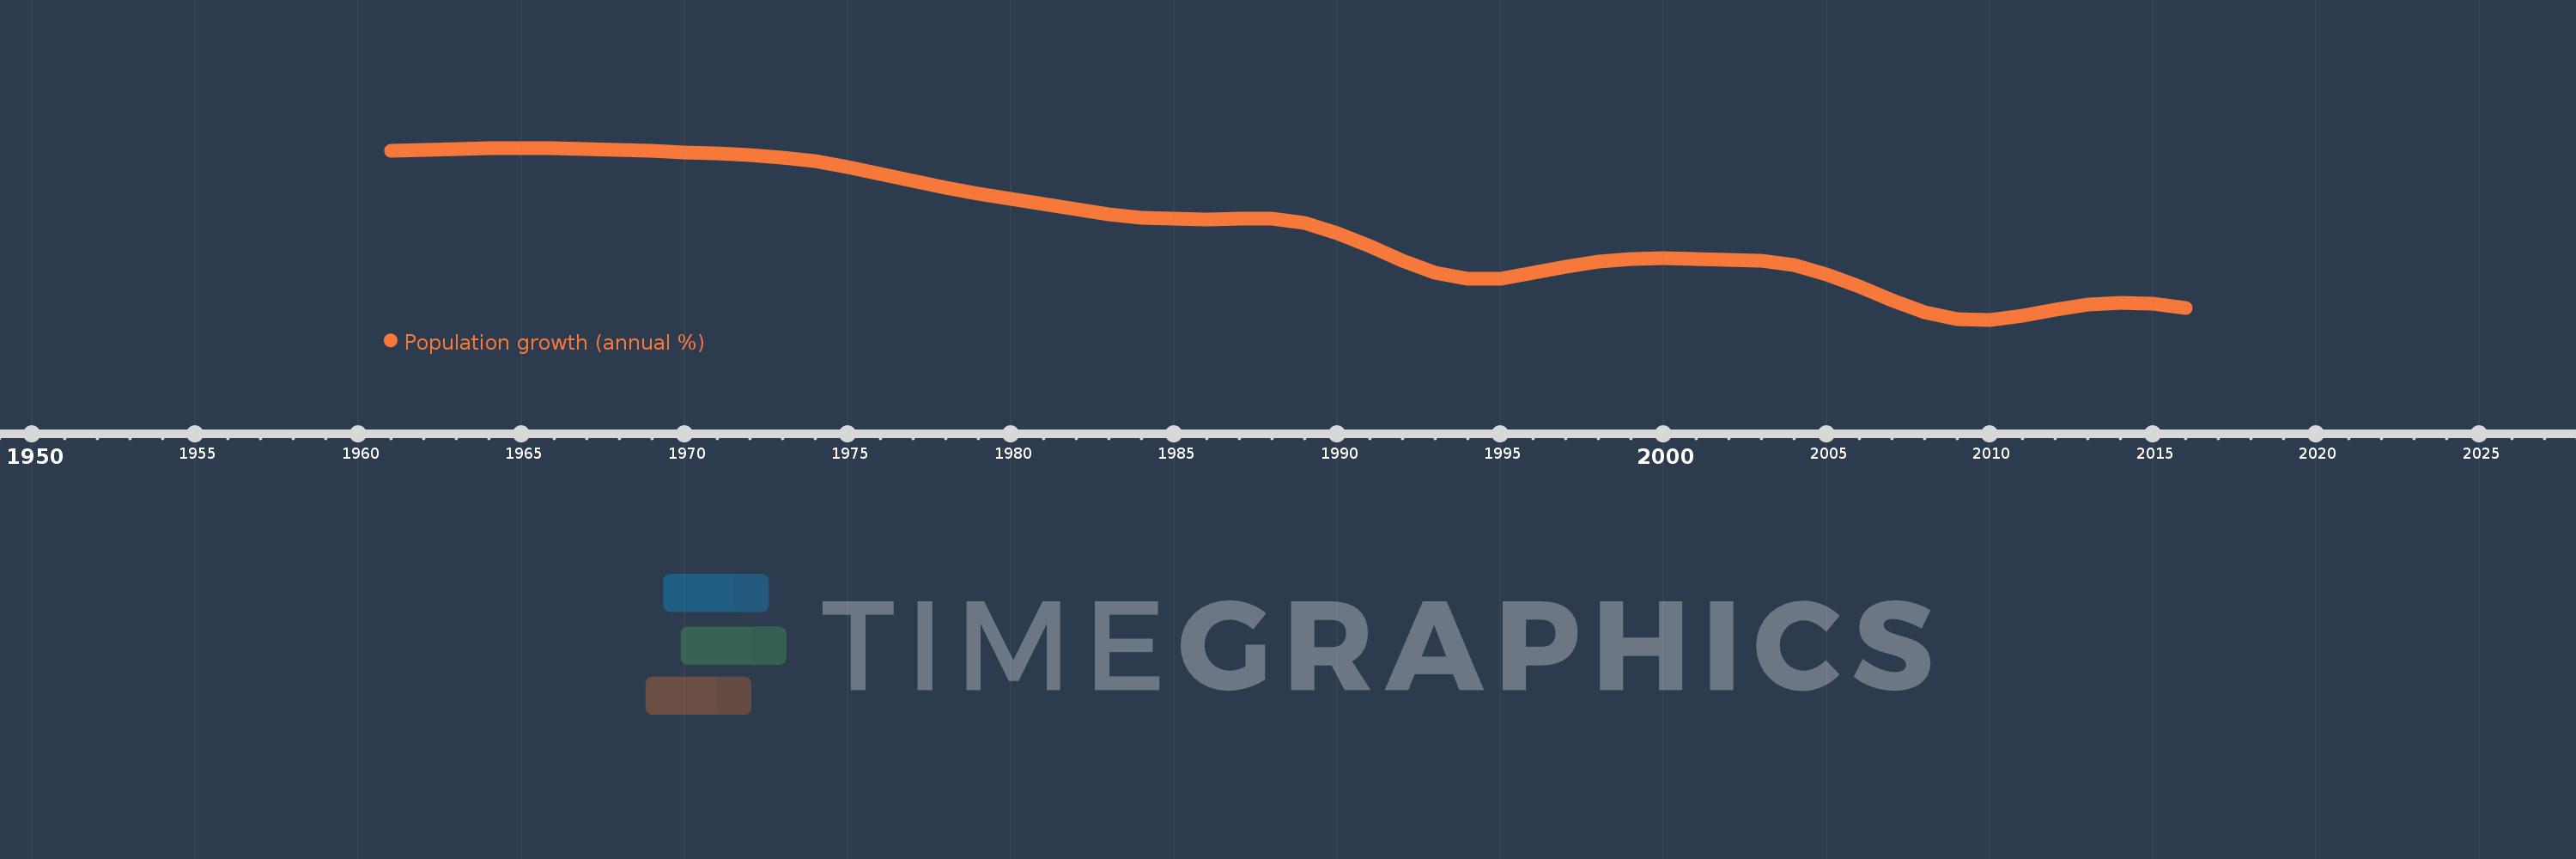
Population growth (annual %)
2016,2015,2014,2013,2012,2011,2010,2009,2008,2007,2006,2005,2004,2003,2002,2001,2000,1999,1998,1997,1996,1995,1994,1993,1992,1991,1990,1989,1988,1987,1986,1985,1984,1983,1982,1981,1980,1979,1978,1977,1976,1975,1974,1973,1972,1971,1970,1969,1968,1967,1966,1965,1964,1963,1962,1961
This statistics in other country:
AfghanistanAlbaniaAlgeriaAmerican SamoaAndorraAngolaAntigua and BarbudaArab WorldArgentinaArmeniaArubaAustraliaAustriaAzerbaijanBahamas, TheBahrainBangladeshBarbadosBelarusBelgiumBelizeBeninBermudaBhutanBoliviaBosnia and HerzegovinaBotswanaBrazilBritish Virgin IslandsBrunei DarussalamBulgariaBurkina FasoBurundiCabo VerdeCambodiaCameroonCanadaCaribbean small statesCayman IslandsCentral African RepublicCentral Europe and the BalticsChadChannel IslandsChileChinaColombiaComorosCongo, Dem. Rep.Congo, Rep.Costa RicaCote d'IvoireCroatiaCubaCuracaoCyprusCzech RepublicDenmarkDjiboutiDominicaDominican RepublicEarly-demographic dividendEast Asia & PacificEast Asia & Pacific (excluding high income)East Asia & Pacific (IDA & IBRD countries)EcuadorEgypt, Arab Rep.El SalvadorEquatorial GuineaEritreaEstoniaEthiopiaEuro areaEurope & Central AsiaEurope & Central Asia (excluding high income)Europe & Central Asia (IDA & IBRD countries)European UnionFaroe IslandsFijiFinlandFragile and conflict affected situationsFranceFrench PolynesiaGabonGambia, TheGeorgiaGermanyGhanaGibraltarGreeceGreenlandGrenadaGuamGuatemalaGuineaGuinea-BissauGuyanaHaitiHeavily indebted poor countries (HIPC)High incomeHondurasHong Kong SAR, ChinaHungaryIBRD onlyIcelandIDA & IBRD totalIDA blendIDA onlyIDA totalIndiaIndonesiaIran, Islamic Rep.IraqIrelandIsle of ManIsraelItalyJamaicaJapanJordanKazakhstanKenyaKiribatiKorea, Dem. People’s Rep.Korea, Rep.KosovoKuwaitKyrgyz RepublicLao PDRLate-demographic dividendLatin America & Caribbean Latin America & Caribbean (excluding high income)Latin America & the Caribbean (IDA & IBRD countries)LatviaLeast developed countries: UN classificationLebanonLesothoLiberiaLibyaLiechtensteinLithuaniaLow & middle incomeLow incomeLower middle incomeLuxembourgMacao SAR, ChinaMacedonia, FYRMadagascarMalawiMalaysiaMaldivesMaliMaltaMarshall IslandsMauritaniaMauritiusMexicoMicronesia, Fed. Sts.Middle East & North AfricaMiddle East & North Africa (excluding high income)Middle East & North Africa (IDA & IBRD countries)Middle incomeMoldovaMonacoMongoliaMontenegroMoroccoMozambiqueMyanmarNamibiaNauruNepalNetherlandsNew CaledoniaNew ZealandNicaraguaNigerNigeriaNorth AmericaNorthern Mariana IslandsNorwayOECD membersOmanOther small statesPacific island small statesPakistanPalauPanamaPapua New GuineaParaguayPeruPhilippinesPolandPortugalPost-demographic dividendPre-demographic dividendPuerto RicoQatarRomaniaRussian FederationRwandaSamoaSan MarinoSao Tome and PrincipeSaudi ArabiaSenegalSerbiaSeychellesSierra LeoneSingaporeSint Maarten (Dutch part)Slovak RepublicSloveniaSmall statesSolomon IslandsSomaliaSouth AfricaSouth AsiaSouth Asia (IDA & IBRD)South SudanSpainSri LankaSt. Kitts and NevisSt. LuciaSt. Martin (French part)St. Vincent and the GrenadinesSub-Saharan Africa Sub-Saharan Africa (excluding high income)Sub-Saharan Africa (IDA & IBRD countries)SudanSurinameSwazilandSwedenSwitzerlandSyrian Arab RepublicTajikistanTanzaniaThailandTimor-LesteTogoTongaTrinidad and TobagoTunisiaTurkeyTurkmenistanTurks and Caicos IslandsTuvaluUgandaUkraineUnited Arab EmiratesUnited KingdomUnited StatesUpper middle incomeUruguayUzbekistanVanuatuVenezuela, RBVietnamVirgin Islands (U.S.)West Bank and GazaWorldYemen, Rep.ZambiaZimbabwe Timeline:
This timeline shows a graph from 1961 to 2016 of Thailand. No data until 1960. Number of actual observations by date: 56.
Source name:
World Development Indicators
Source organization:
Derived from total population. Population source: (1) United Nations Population Division. World Population Prospects, (2) United Nations Statistical Division. Population and Vital Statistics Report (various years), (3) Census reports and other statistical
Categories, topics:
Climate Change, Health
Last updated:
apr 23, 2017
Indicators value changes by year
At the date of observation
Value
Absolute change
Change from previous value
jan 1, 1961
2.952
+2.952
0.0%
jan 1, 1962
2.974
+0.022
0.75%
jan 1, 1963
2.991
+0.017
0.56%
jan 1, 1964
3.001
+0.011
0.35%
jan 1, 1965
3.005
+0.004
0.14%
jan 1, 1966
3.003
-0.002
-0.08%
jan 1, 1967
2.991
-0.012
-0.39%
jan 1, 1968
2.973
-0.018
-0.62%
jan 1, 1969
2.953
-0.02
-0.66%
jan 1, 1970
2.934
-0.019
-0.66%
jan 1, 1971
2.911
-0.023
-0.79%
jan 1, 1972
2.886
-0.025
-0.85%
jan 1, 1973
2.849
-0.037
-1.29%
jan 1, 1974
2.785
-0.064
-2.25%
jan 1, 1975
2.689
-0.096
-3.44%
jan 1, 1976
2.573
-0.116
-4.3%
jan 1, 1977
2.454
-0.119
-4.62%
jan 1, 1978
2.344
-0.11
-4.48%
jan 1, 1979
2.243
-0.102
-4.33%
jan 1, 1980
2.154
-0.089
-3.98%
jan 1, 1981
2.075
-0.079
-3.66%
jan 1, 1982
1.988
-0.087
-4.17%
jan 1, 1983
1.903
-0.085
-4.28%
jan 1, 1984
1.845
-0.058
-3.04%
jan 1, 1985
1.821
-0.024
-1.3%
jan 1, 1986
1.815
-0.006
-0.34%
jan 1, 1987
1.83
+0.015
0.85%
jan 1, 1988
1.826
-0.004
-0.24%
jan 1, 1989
1.752
-0.074
-4.05%
jan 1, 1990
1.588
-0.164
-9.37%
jan 1, 1991
1.37
-0.218
-13.71%
jan 1, 1992
1.13
-0.24
-17.52%
jan 1, 1993
0.932
-0.199
-17.58%
jan 1, 1994
0.821
-0.111
-11.89%
jan 1, 1995
0.83
+0.009
1.05%
jan 1, 1996
0.921
+0.091
11.03%
jan 1, 1997
1.029
+0.108
11.71%
jan 1, 1998
1.106
+0.077
7.51%
jan 1, 1999
1.159
+0.053
4.82%
jan 1, 2000
1.173
+0.014
1.21%
jan 1, 2001
1.154
-0.019
-1.65%
jan 1, 2002
1.145
-0.009
-0.8%
jan 1, 2003
1.131
-0.014
-1.18%
jan 1, 2004
1.056
-0.076
-6.7%
jan 1, 2005
0.902
-0.154
-14.55%
jan 1, 2006
0.7
-0.202
-22.39%
jan 1, 2007
0.47
-0.23
-32.81%
jan 1, 2008
0.27
-0.2
-42.54%
jan 1, 2009
0.15
-0.12
-44.45%
jan 1, 2010
0.143
-0.007
-4.9%
jan 1, 2011
0.216
+0.073
51.22%
jan 1, 2012
0.316
+0.1
46.27%
jan 1, 2013
0.39
+0.074
23.38%
jan 1, 2014
0.427
+0.037
9.55%
jan 1, 2015
0.406
-0.021
-4.83%
jan 1, 2016
0.344
-0.062
-15.32%
Ranking of countries by current statistics by years


Comments: