29
/
en
AIzaSyAYiBZKx7MnpbEhh9jyipgxe19OcubqV5w
April 1, 2024
135973
Gabon
GAB
true
2
1
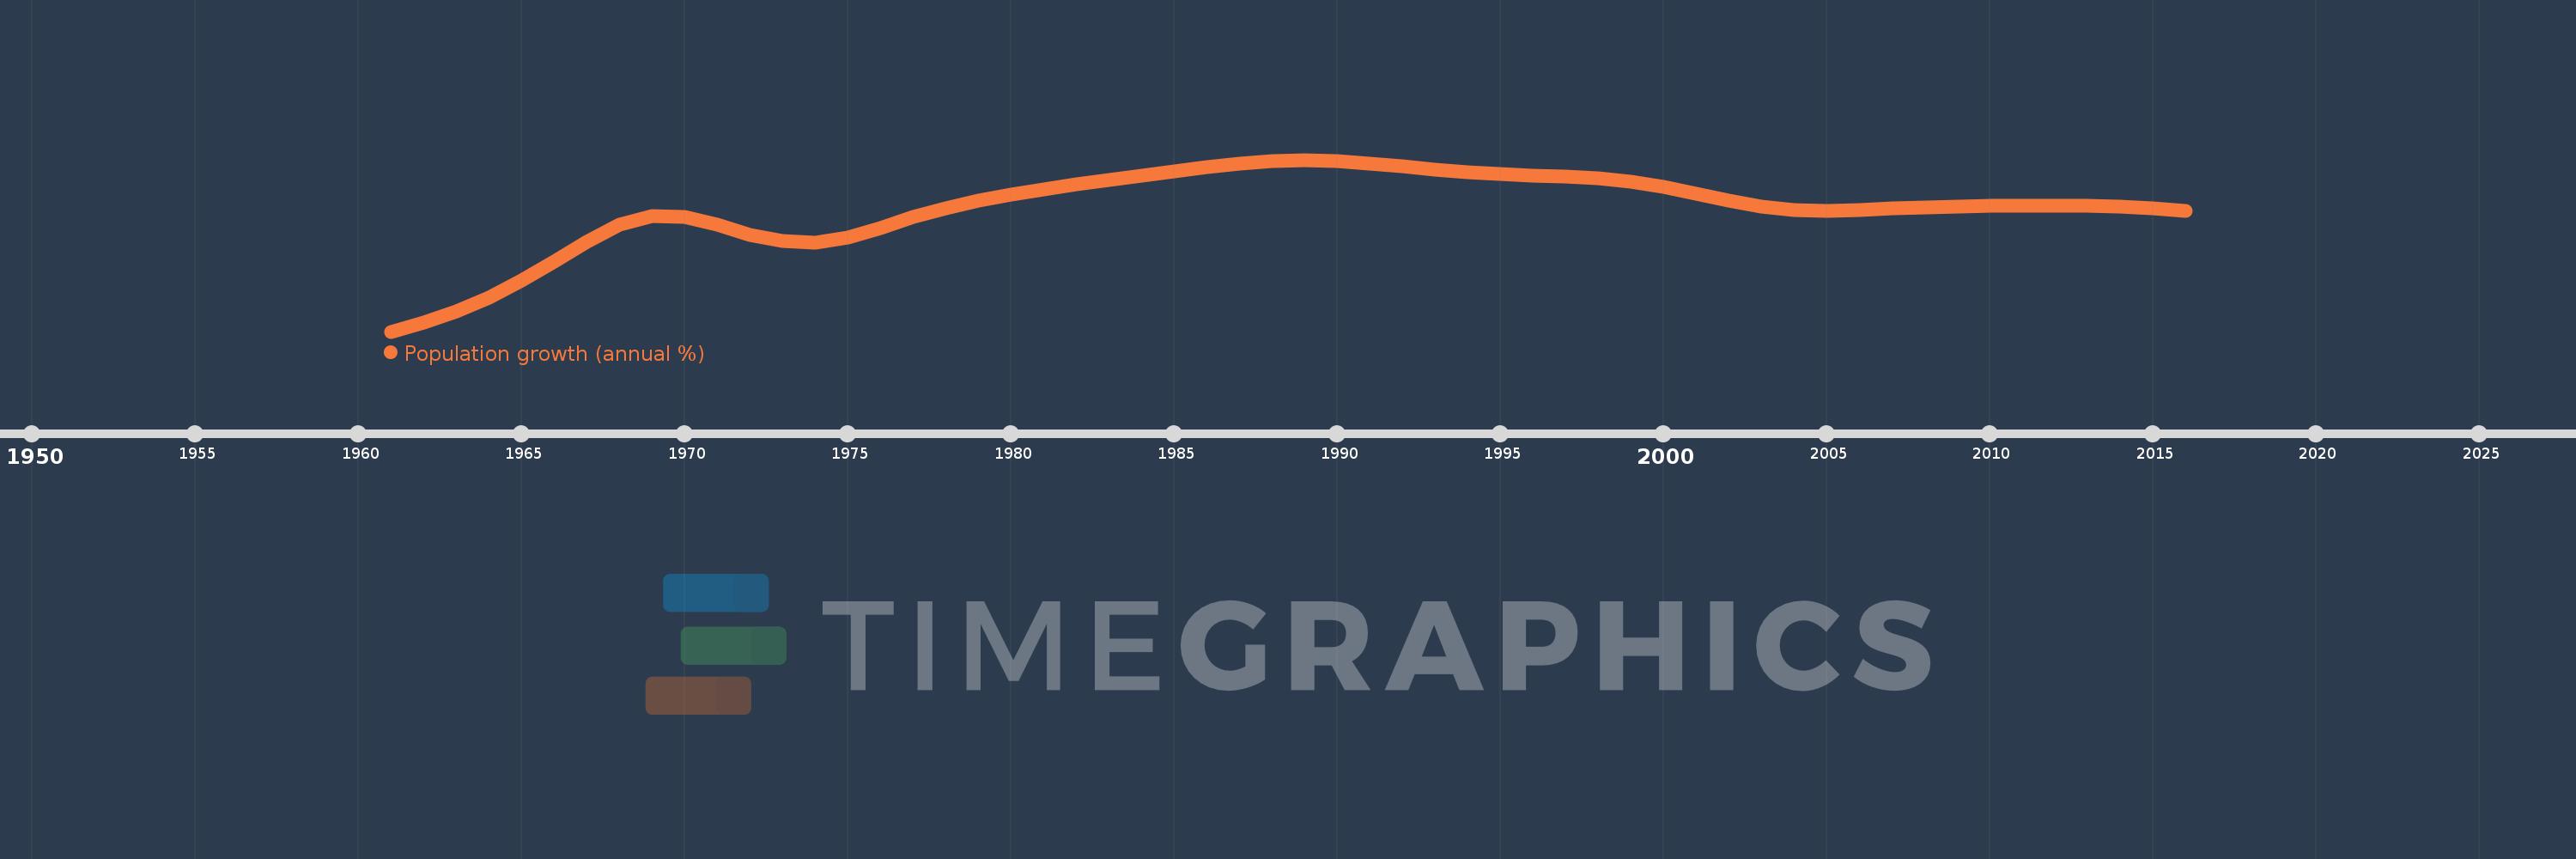
Population growth (annual %)
2016,2015,2014,2013,2012,2011,2010,2009,2008,2007,2006,2005,2004,2003,2002,2001,2000,1999,1998,1997,1996,1995,1994,1993,1992,1991,1990,1989,1988,1987,1986,1985,1984,1983,1982,1981,1980,1979,1978,1977,1976,1975,1974,1973,1972,1971,1970,1969,1968,1967,1966,1965,1964,1963,1962,1961
This statistics in other country:
AfghanistanAlbaniaAlgeriaAmerican SamoaAndorraAngolaAntigua and BarbudaArab WorldArgentinaArmeniaArubaAustraliaAustriaAzerbaijanBahamas, TheBahrainBangladeshBarbadosBelarusBelgiumBelizeBeninBermudaBhutanBoliviaBosnia and HerzegovinaBotswanaBrazilBritish Virgin IslandsBrunei DarussalamBulgariaBurkina FasoBurundiCabo VerdeCambodiaCameroonCanadaCaribbean small statesCayman IslandsCentral African RepublicCentral Europe and the BalticsChadChannel IslandsChileChinaColombiaComorosCongo, Dem. Rep.Congo, Rep.Costa RicaCote d'IvoireCroatiaCubaCuracaoCyprusCzech RepublicDenmarkDjiboutiDominicaDominican RepublicEarly-demographic dividendEast Asia & PacificEast Asia & Pacific (excluding high income)East Asia & Pacific (IDA & IBRD countries)EcuadorEgypt, Arab Rep.El SalvadorEquatorial GuineaEritreaEstoniaEthiopiaEuro areaEurope & Central AsiaEurope & Central Asia (excluding high income)Europe & Central Asia (IDA & IBRD countries)European UnionFaroe IslandsFijiFinlandFragile and conflict affected situationsFranceFrench PolynesiaGabonGambia, TheGeorgiaGermanyGhanaGibraltarGreeceGreenlandGrenadaGuamGuatemalaGuineaGuinea-BissauGuyanaHaitiHeavily indebted poor countries (HIPC)High incomeHondurasHong Kong SAR, ChinaHungaryIBRD onlyIcelandIDA & IBRD totalIDA blendIDA onlyIDA totalIndiaIndonesiaIran, Islamic Rep.IraqIrelandIsle of ManIsraelItalyJamaicaJapanJordanKazakhstanKenyaKiribatiKorea, Dem. People’s Rep.Korea, Rep.KosovoKuwaitKyrgyz RepublicLao PDRLate-demographic dividendLatin America & Caribbean Latin America & Caribbean (excluding high income)Latin America & the Caribbean (IDA & IBRD countries)LatviaLeast developed countries: UN classificationLebanonLesothoLiberiaLibyaLiechtensteinLithuaniaLow & middle incomeLow incomeLower middle incomeLuxembourgMacao SAR, ChinaMacedonia, FYRMadagascarMalawiMalaysiaMaldivesMaliMaltaMarshall IslandsMauritaniaMauritiusMexicoMicronesia, Fed. Sts.Middle East & North AfricaMiddle East & North Africa (excluding high income)Middle East & North Africa (IDA & IBRD countries)Middle incomeMoldovaMonacoMongoliaMontenegroMoroccoMozambiqueMyanmarNamibiaNauruNepalNetherlandsNew CaledoniaNew ZealandNicaraguaNigerNigeriaNorth AmericaNorthern Mariana IslandsNorwayOECD membersOmanOther small statesPacific island small statesPakistanPalauPanamaPapua New GuineaParaguayPeruPhilippinesPolandPortugalPost-demographic dividendPre-demographic dividendPuerto RicoQatarRomaniaRussian FederationRwandaSamoaSan MarinoSao Tome and PrincipeSaudi ArabiaSenegalSerbiaSeychellesSierra LeoneSingaporeSint Maarten (Dutch part)Slovak RepublicSloveniaSmall statesSolomon IslandsSomaliaSouth AfricaSouth AsiaSouth Asia (IDA & IBRD)South SudanSpainSri LankaSt. Kitts and NevisSt. LuciaSt. Martin (French part)St. Vincent and the GrenadinesSub-Saharan Africa Sub-Saharan Africa (excluding high income)Sub-Saharan Africa (IDA & IBRD countries)SudanSurinameSwazilandSwedenSwitzerlandSyrian Arab RepublicTajikistanTanzaniaThailandTimor-LesteTogoTongaTrinidad and TobagoTunisiaTurkeyTurkmenistanTurks and Caicos IslandsTuvaluUgandaUkraineUnited Arab EmiratesUnited KingdomUnited StatesUpper middle incomeUruguayUzbekistanVanuatuVenezuela, RBVietnamVirgin Islands (U.S.)West Bank and GazaWorldYemen, Rep.ZambiaZimbabwe Timeline:
This timeline shows a graph from 1961 to 2016 of Gabon. No data until 1960. Number of actual observations by date: 56.
Source name:
World Development Indicators
Source organization:
Derived from total population. Population source: (1) United Nations Population Division. World Population Prospects, (2) United Nations Statistical Division. Population and Vital Statistics Report (various years), (3) Census reports and other statistical
Categories, topics:
Climate Change, Health
Last updated:
apr 23, 2017
Indicators value changes by year
At the date of observation
Value
Absolute change
Change from previous value
jan 1, 1961
0.891
+0.891
0.0%
jan 1, 1962
0.994
+0.102
11.47%
jan 1, 1963
1.111
+0.117
11.8%
jan 1, 1964
1.26
+0.149
13.42%
jan 1, 1965
1.447
+0.187
14.82%
jan 1, 1966
1.651
+0.204
14.12%
jan 1, 1967
1.87
+0.219
13.25%
jan 1, 1968
2.055
+0.186
9.93%
jan 1, 1969
2.152
+0.097
4.71%
jan 1, 1970
2.139
-0.013
-0.6%
jan 1, 1971
2.055
-0.084
-3.92%
jan 1, 1972
1.949
-0.106
-5.17%
jan 1, 1973
1.876
-0.073
-3.75%
jan 1, 1974
1.858
-0.018
-0.98%
jan 1, 1975
1.915
+0.057
3.09%
jan 1, 1976
2.024
+0.109
5.68%
jan 1, 1977
2.14
+0.116
5.75%
jan 1, 1978
2.236
+0.096
4.5%
jan 1, 1979
2.322
+0.086
3.84%
jan 1, 1980
2.391
+0.069
2.95%
jan 1, 1981
2.446
+0.055
2.32%
jan 1, 1982
2.496
+0.05
2.03%
jan 1, 1983
2.545
+0.05
1.99%
jan 1, 1984
2.594
+0.048
1.89%
jan 1, 1985
2.642
+0.048
1.87%
jan 1, 1986
2.686
+0.044
1.68%
jan 1, 1987
2.727
+0.041
1.51%
jan 1, 1988
2.756
+0.029
1.07%
jan 1, 1989
2.766
+0.01
0.37%
jan 1, 1990
2.754
-0.012
-0.43%
jan 1, 1991
2.727
-0.027
-0.98%
jan 1, 1992
2.692
-0.035
-1.3%
jan 1, 1993
2.658
-0.034
-1.28%
jan 1, 1994
2.629
-0.029
-1.08%
jan 1, 1995
2.609
-0.019
-0.74%
jan 1, 1996
2.594
-0.015
-0.58%
jan 1, 1997
2.583
-0.011
-0.43%
jan 1, 1998
2.564
-0.019
-0.73%
jan 1, 1999
2.527
-0.037
-1.45%
jan 1, 2000
2.467
-0.06
-2.39%
jan 1, 2001
2.394
-0.073
-2.94%
jan 1, 2002
2.318
-0.076
-3.16%
jan 1, 2003
2.256
-0.063
-2.7%
jan 1, 2004
2.217
-0.039
-1.72%
jan 1, 2005
2.208
-0.009
-0.39%
jan 1, 2006
2.22
+0.012
0.54%
jan 1, 2007
2.235
+0.015
0.67%
jan 1, 2008
2.245
+0.009
0.42%
jan 1, 2009
2.253
+0.009
0.4%
jan 1, 2010
2.26
+0.007
0.29%
jan 1, 2011
2.263
+0.003
0.15%
jan 1, 2012
2.267
+0.004
0.18%
jan 1, 2013
2.269
+0.001
0.05%
jan 1, 2014
2.259
-0.01
-0.43%
jan 1, 2015
2.236
-0.023
-1.0%
jan 1, 2016
2.205
-0.032
-1.42%
Ranking of countries by current statistics by years


Comments: