29
/
en
AIzaSyAYiBZKx7MnpbEhh9jyipgxe19OcubqV5w
April 1, 2024
40992
Late-demographic dividend
LTE
false
2
1
Population growth (annual %)
2016,2015,2014,2013,2012,2011,2010,2009,2008,2007,2006,2005,2004,2003,2002,2001,2000,1999,1998,1997,1996,1995,1994,1993,1992,1991,1990,1989,1988,1987,1986,1985,1984,1983,1982,1981,1980,1979,1978,1977,1976,1975,1974,1973,1972,1971,1970,1969,1968,1967,1966,1965,1964,1963,1962
This statistics in other country:
AfghanistanAlbaniaAlgeriaAmerican SamoaAndorraAngolaAntigua and BarbudaArab WorldArgentinaArmeniaArubaAustraliaAustriaAzerbaijanBahamas, TheBahrainBangladeshBarbadosBelarusBelgiumBelizeBeninBermudaBhutanBoliviaBosnia and HerzegovinaBotswanaBrazilBritish Virgin IslandsBrunei DarussalamBulgariaBurkina FasoBurundiCabo VerdeCambodiaCameroonCanadaCaribbean small statesCayman IslandsCentral African RepublicCentral Europe and the BalticsChadChannel IslandsChileChinaColombiaComorosCongo, Dem. Rep.Congo, Rep.Costa RicaCote d'IvoireCroatiaCubaCuracaoCyprusCzech RepublicDenmarkDjiboutiDominicaDominican RepublicEarly-demographic dividendEast Asia & PacificEast Asia & Pacific (excluding high income)East Asia & Pacific (IDA & IBRD countries)EcuadorEgypt, Arab Rep.El SalvadorEquatorial GuineaEritreaEstoniaEthiopiaEuro areaEurope & Central AsiaEurope & Central Asia (excluding high income)Europe & Central Asia (IDA & IBRD countries)European UnionFaroe IslandsFijiFinlandFragile and conflict affected situationsFranceFrench PolynesiaGabonGambia, TheGeorgiaGermanyGhanaGibraltarGreeceGreenlandGrenadaGuamGuatemalaGuineaGuinea-BissauGuyanaHaitiHeavily indebted poor countries (HIPC)High incomeHondurasHong Kong SAR, ChinaHungaryIBRD onlyIcelandIDA & IBRD totalIDA blendIDA onlyIDA totalIndiaIndonesiaIran, Islamic Rep.IraqIrelandIsle of ManIsraelItalyJamaicaJapanJordanKazakhstanKenyaKiribatiKorea, Dem. People’s Rep.Korea, Rep.KosovoKuwaitKyrgyz RepublicLao PDRLate-demographic dividendLatin America & Caribbean Latin America & Caribbean (excluding high income)Latin America & the Caribbean (IDA & IBRD countries)LatviaLeast developed countries: UN classificationLebanonLesothoLiberiaLibyaLiechtensteinLithuaniaLow & middle incomeLow incomeLower middle incomeLuxembourgMacao SAR, ChinaMacedonia, FYRMadagascarMalawiMalaysiaMaldivesMaliMaltaMarshall IslandsMauritaniaMauritiusMexicoMicronesia, Fed. Sts.Middle East & North AfricaMiddle East & North Africa (excluding high income)Middle East & North Africa (IDA & IBRD countries)Middle incomeMoldovaMonacoMongoliaMontenegroMoroccoMozambiqueMyanmarNamibiaNauruNepalNetherlandsNew CaledoniaNew ZealandNicaraguaNigerNigeriaNorth AmericaNorthern Mariana IslandsNorwayOECD membersOmanOther small statesPacific island small statesPakistanPalauPanamaPapua New GuineaParaguayPeruPhilippinesPolandPortugalPost-demographic dividendPre-demographic dividendPuerto RicoQatarRomaniaRussian FederationRwandaSamoaSan MarinoSao Tome and PrincipeSaudi ArabiaSenegalSerbiaSeychellesSierra LeoneSingaporeSint Maarten (Dutch part)Slovak RepublicSloveniaSmall statesSolomon IslandsSomaliaSouth AfricaSouth AsiaSouth Asia (IDA & IBRD)South SudanSpainSri LankaSt. Kitts and NevisSt. LuciaSt. Martin (French part)St. Vincent and the GrenadinesSub-Saharan Africa Sub-Saharan Africa (excluding high income)Sub-Saharan Africa (IDA & IBRD countries)SudanSurinameSwazilandSwedenSwitzerlandSyrian Arab RepublicTajikistanTanzaniaThailandTimor-LesteTogoTongaTrinidad and TobagoTunisiaTurkeyTurkmenistanTurks and Caicos IslandsTuvaluUgandaUkraineUnited Arab EmiratesUnited KingdomUnited StatesUpper middle incomeUruguayUzbekistanVanuatuVenezuela, RBVietnamVirgin Islands (U.S.)West Bank and GazaWorldYemen, Rep.ZambiaZimbabwe Timeline:
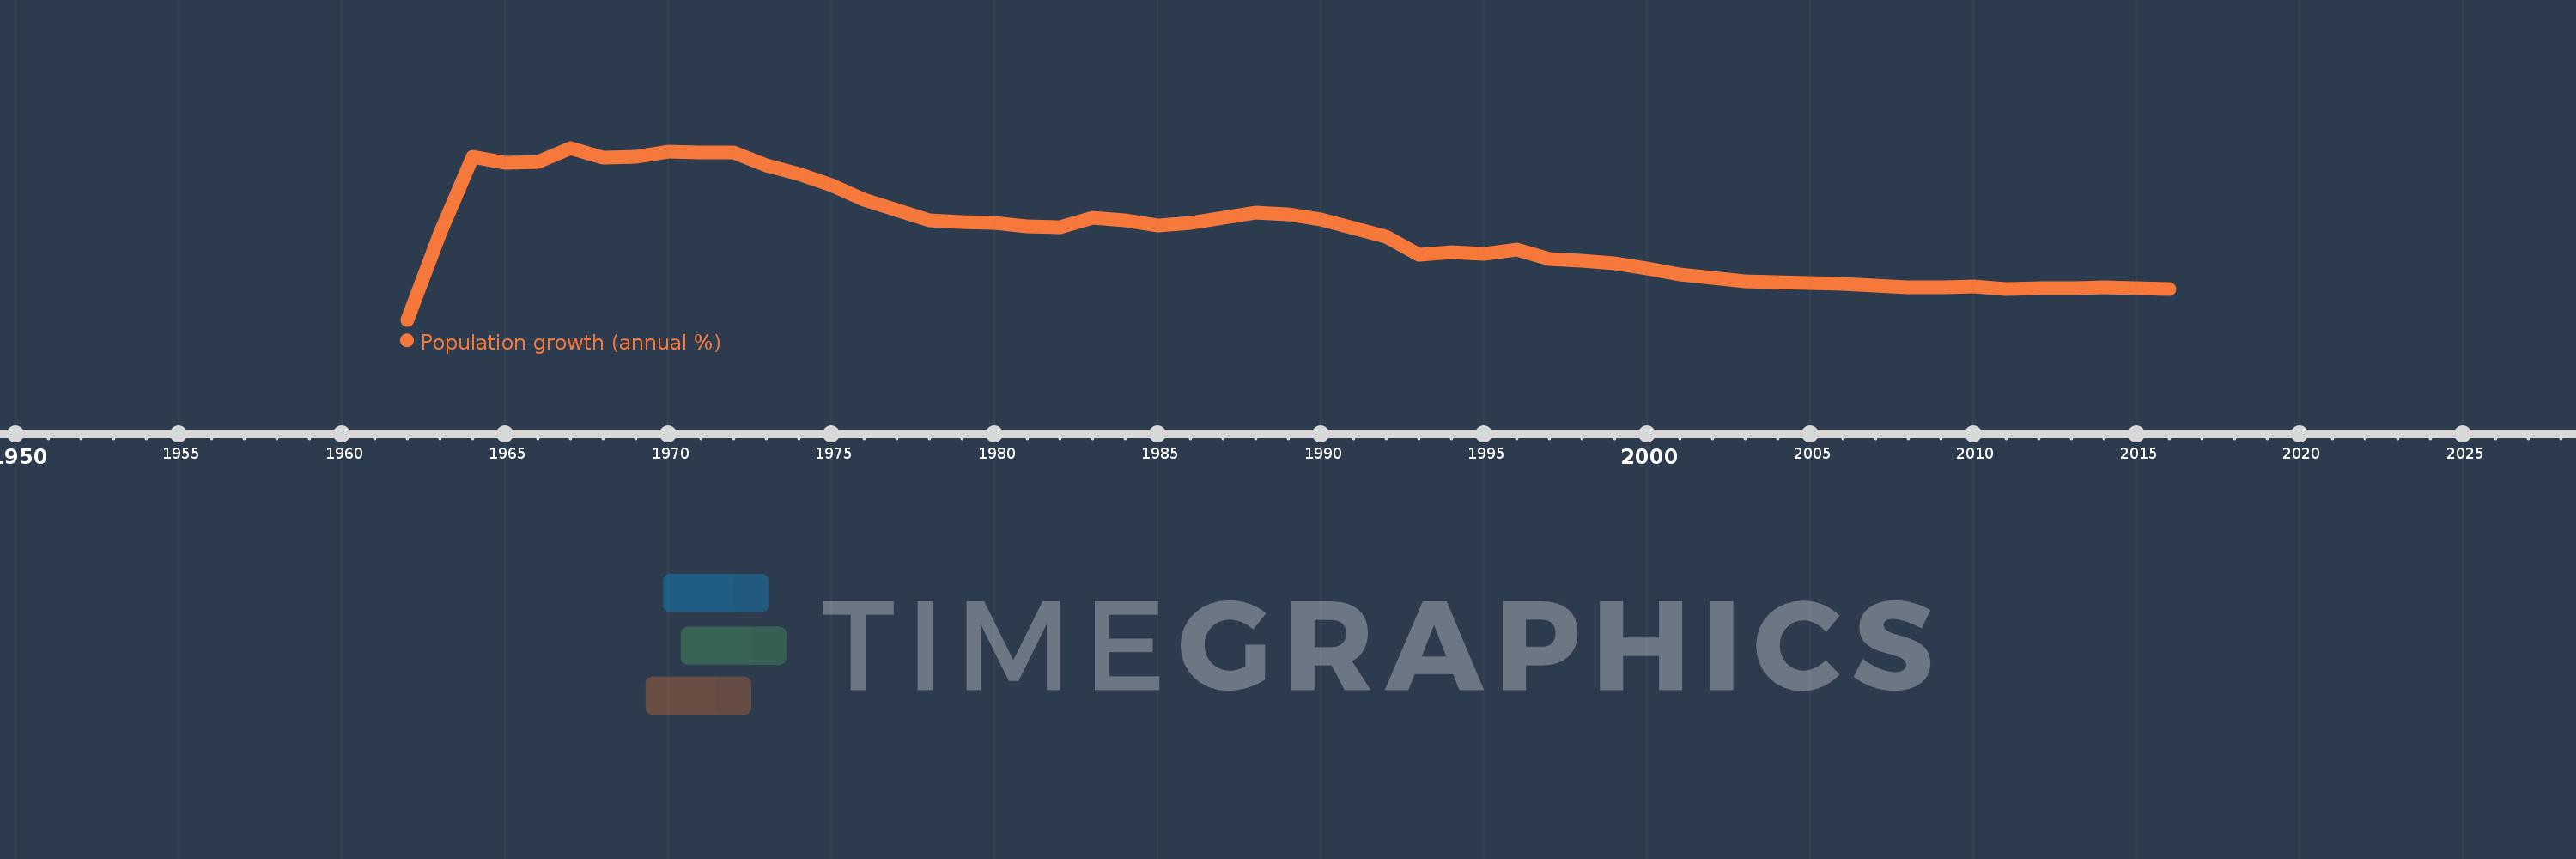
This timeline shows a graph from 1962 to 2016 of Late-demographic dividend. No data until 1961. Number of actual observations by date: 55.
Source name:
World Development Indicators
Source organization:
Derived from total population. Population source: (1) United Nations Population Division. World Population Prospects, (2) United Nations Statistical Division. Population and Vital Statistics Report (various years), (3) Census reports and other statistical
Categories, topics:
Climate Change, Health
Last updated:
apr 23, 2017
Indicators value changes by year
At the date of observation
Value
Absolute change
Change from previous value
jan 1, 1963
1.314
+1.114
556.3%
jan 1, 1964
2.299
+0.985
74.97%
jan 1, 1965
2.226
-0.073
-3.19%
jan 1, 1966
2.234
+0.008
0.36%
jan 1, 1967
2.416
+0.182
8.15%
jan 1, 1968
2.289
-0.127
-5.26%
jan 1, 1969
2.304
+0.015
0.67%
jan 1, 1970
2.369
+0.065
2.82%
jan 1, 1971
2.359
-0.01
-0.41%
jan 1, 1972
2.355
-0.005
-0.2%
jan 1, 1973
2.195
-0.16
-6.79%
jan 1, 1974
2.076
-0.119
-5.43%
jan 1, 1975
1.933
-0.142
-6.86%
jan 1, 1976
1.744
-0.189
-9.79%
jan 1, 1977
1.611
-0.133
-7.64%
jan 1, 1978
1.482
-0.129
-8.0%
jan 1, 1979
1.457
-0.025
-1.67%
jan 1, 1980
1.45
-0.007
-0.51%
jan 1, 1981
1.401
-0.049
-3.36%
jan 1, 1982
1.397
-0.004
-0.3%
jan 1, 1983
1.512
+0.115
8.26%
jan 1, 1984
1.486
-0.026
-1.75%
jan 1, 1985
1.41
-0.076
-5.11%
jan 1, 1986
1.444
+0.034
2.39%
jan 1, 1987
1.519
+0.075
5.21%
jan 1, 1988
1.58
+0.061
4.03%
jan 1, 1989
1.561
-0.019
-1.23%
jan 1, 1990
1.489
-0.071
-4.57%
jan 1, 1991
1.384
-0.105
-7.06%
jan 1, 1992
1.27
-0.114
-8.22%
jan 1, 1993
1.042
-0.228
-17.98%
jan 1, 1994
1.075
+0.033
3.15%
jan 1, 1995
1.05
-0.025
-2.35%
jan 1, 1996
1.1
+0.05
4.78%
jan 1, 1997
0.982
-0.118
-10.69%
jan 1, 1998
0.965
-0.017
-1.71%
jan 1, 1999
0.927
-0.039
-4.01%
jan 1, 2000
0.863
-0.064
-6.92%
jan 1, 2001
0.782
-0.08
-9.3%
jan 1, 2002
0.745
-0.037
-4.78%
jan 1, 2003
0.7
-0.045
-6.04%
jan 1, 2004
0.68
-0.019
-2.78%
jan 1, 2005
0.669
-0.012
-1.73%
jan 1, 2006
0.662
-0.006
-0.97%
jan 1, 2007
0.641
-0.022
-3.27%
jan 1, 2008
0.613
-0.027
-4.24%
jan 1, 2009
0.613
0.0
-0.08%
jan 1, 2010
0.624
+0.011
1.76%
jan 1, 2011
0.596
-0.028
-4.43%
jan 1, 2012
0.602
+0.006
0.96%
jan 1, 2013
0.612
+0.01
1.73%
jan 1, 2014
0.614
+0.001
0.23%
jan 1, 2015
0.612
-0.001
-0.22%
jan 1, 2016
0.598
-0.014
-2.34%
Ranking of countries by current statistics by years


Comments: