29
/
en
AIzaSyAYiBZKx7MnpbEhh9jyipgxe19OcubqV5w
April 1, 2024
207244
Nepal
NPL
true
2
1
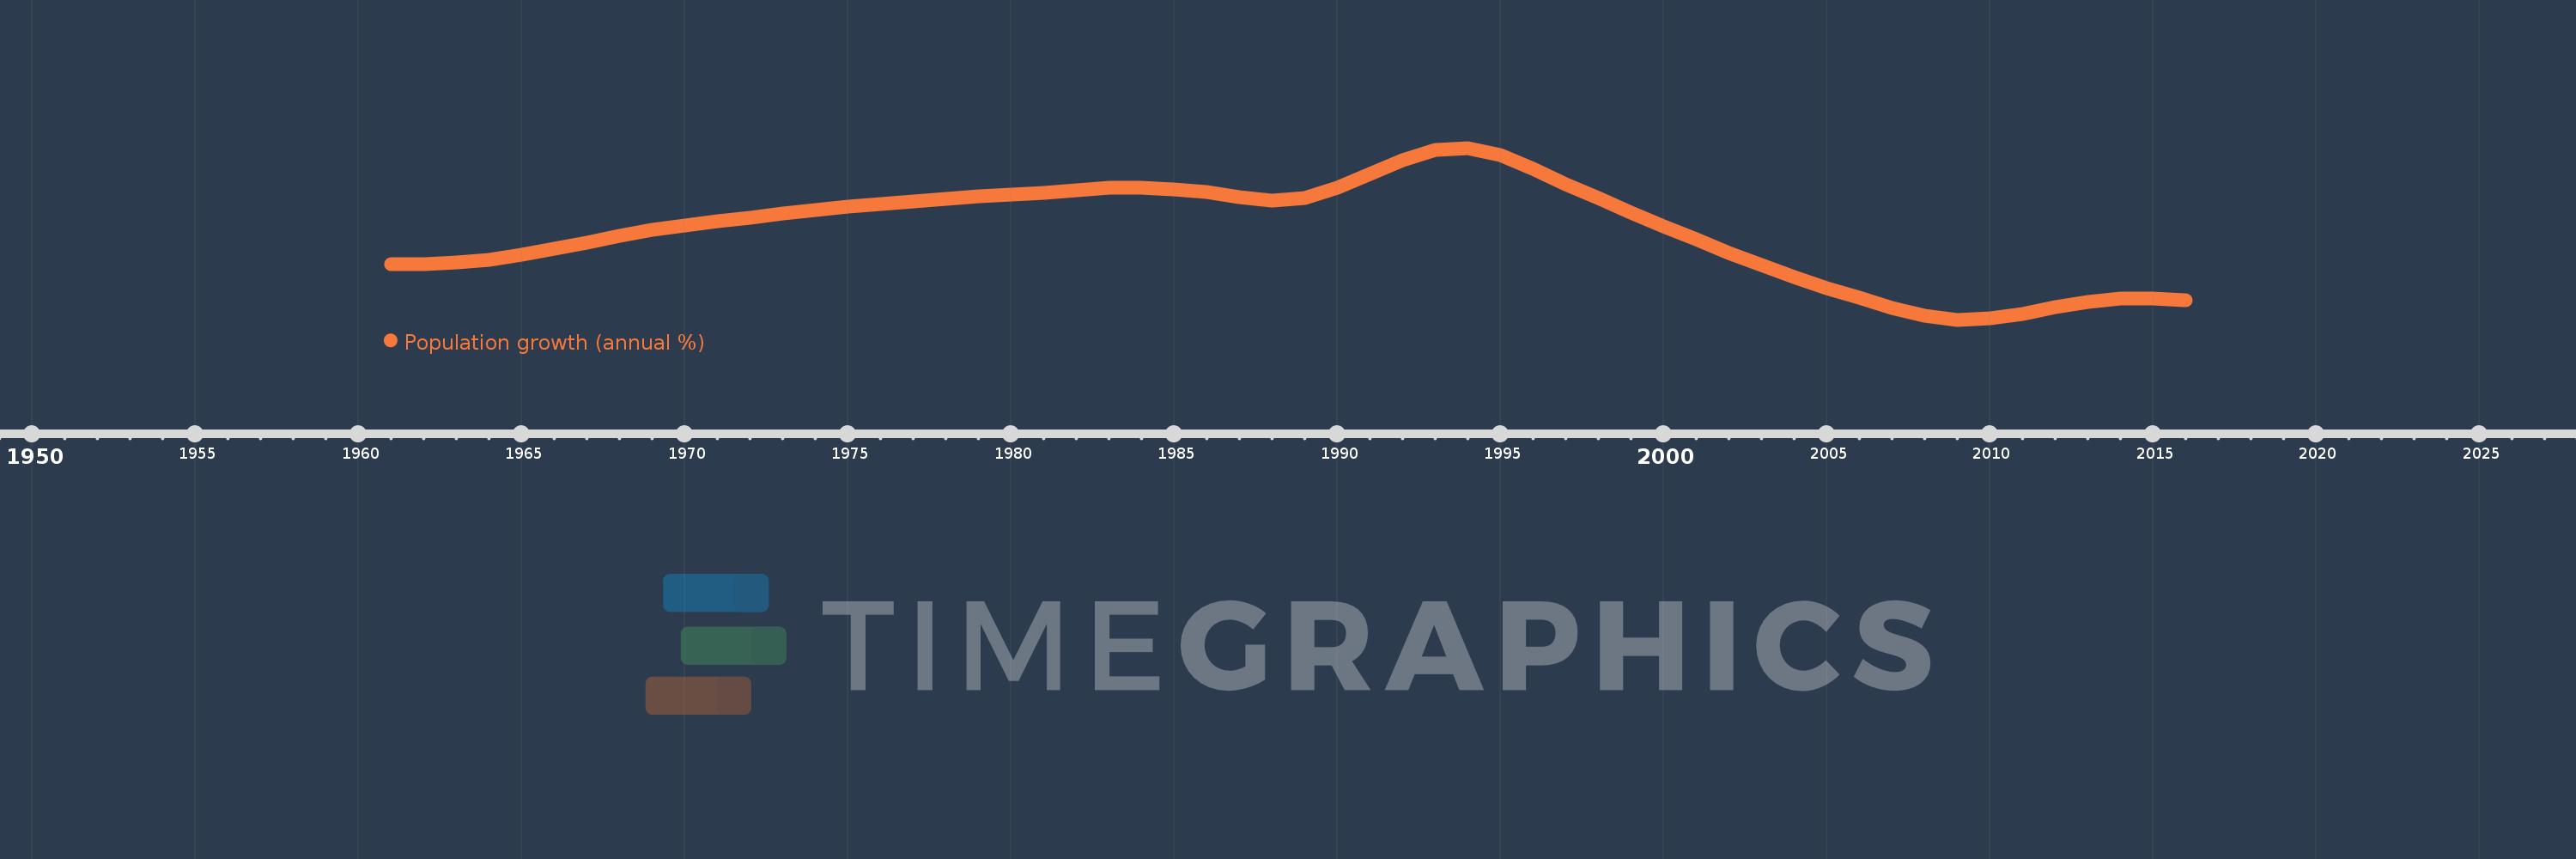
Population growth (annual %)
2016,2015,2014,2013,2012,2011,2010,2009,2008,2007,2006,2005,2004,2003,2002,2001,2000,1999,1998,1997,1996,1995,1994,1993,1992,1991,1990,1989,1988,1987,1986,1985,1984,1983,1982,1981,1980,1979,1978,1977,1976,1975,1974,1973,1972,1971,1970,1969,1968,1967,1966,1965,1964,1963,1962,1961
This statistics in other country:
AfghanistanAlbaniaAlgeriaAmerican SamoaAndorraAngolaAntigua and BarbudaArab WorldArgentinaArmeniaArubaAustraliaAustriaAzerbaijanBahamas, TheBahrainBangladeshBarbadosBelarusBelgiumBelizeBeninBermudaBhutanBoliviaBosnia and HerzegovinaBotswanaBrazilBritish Virgin IslandsBrunei DarussalamBulgariaBurkina FasoBurundiCabo VerdeCambodiaCameroonCanadaCaribbean small statesCayman IslandsCentral African RepublicCentral Europe and the BalticsChadChannel IslandsChileChinaColombiaComorosCongo, Dem. Rep.Congo, Rep.Costa RicaCote d'IvoireCroatiaCubaCuracaoCyprusCzech RepublicDenmarkDjiboutiDominicaDominican RepublicEarly-demographic dividendEast Asia & PacificEast Asia & Pacific (excluding high income)East Asia & Pacific (IDA & IBRD countries)EcuadorEgypt, Arab Rep.El SalvadorEquatorial GuineaEritreaEstoniaEthiopiaEuro areaEurope & Central AsiaEurope & Central Asia (excluding high income)Europe & Central Asia (IDA & IBRD countries)European UnionFaroe IslandsFijiFinlandFragile and conflict affected situationsFranceFrench PolynesiaGabonGambia, TheGeorgiaGermanyGhanaGibraltarGreeceGreenlandGrenadaGuamGuatemalaGuineaGuinea-BissauGuyanaHaitiHeavily indebted poor countries (HIPC)High incomeHondurasHong Kong SAR, ChinaHungaryIBRD onlyIcelandIDA & IBRD totalIDA blendIDA onlyIDA totalIndiaIndonesiaIran, Islamic Rep.IraqIrelandIsle of ManIsraelItalyJamaicaJapanJordanKazakhstanKenyaKiribatiKorea, Dem. People’s Rep.Korea, Rep.KosovoKuwaitKyrgyz RepublicLao PDRLate-demographic dividendLatin America & Caribbean Latin America & Caribbean (excluding high income)Latin America & the Caribbean (IDA & IBRD countries)LatviaLeast developed countries: UN classificationLebanonLesothoLiberiaLibyaLiechtensteinLithuaniaLow & middle incomeLow incomeLower middle incomeLuxembourgMacao SAR, ChinaMacedonia, FYRMadagascarMalawiMalaysiaMaldivesMaliMaltaMarshall IslandsMauritaniaMauritiusMexicoMicronesia, Fed. Sts.Middle East & North AfricaMiddle East & North Africa (excluding high income)Middle East & North Africa (IDA & IBRD countries)Middle incomeMoldovaMonacoMongoliaMontenegroMoroccoMozambiqueMyanmarNamibiaNauruNepalNetherlandsNew CaledoniaNew ZealandNicaraguaNigerNigeriaNorth AmericaNorthern Mariana IslandsNorwayOECD membersOmanOther small statesPacific island small statesPakistanPalauPanamaPapua New GuineaParaguayPeruPhilippinesPolandPortugalPost-demographic dividendPre-demographic dividendPuerto RicoQatarRomaniaRussian FederationRwandaSamoaSan MarinoSao Tome and PrincipeSaudi ArabiaSenegalSerbiaSeychellesSierra LeoneSingaporeSint Maarten (Dutch part)Slovak RepublicSloveniaSmall statesSolomon IslandsSomaliaSouth AfricaSouth AsiaSouth Asia (IDA & IBRD)South SudanSpainSri LankaSt. Kitts and NevisSt. LuciaSt. Martin (French part)St. Vincent and the GrenadinesSub-Saharan Africa Sub-Saharan Africa (excluding high income)Sub-Saharan Africa (IDA & IBRD countries)SudanSurinameSwazilandSwedenSwitzerlandSyrian Arab RepublicTajikistanTanzaniaThailandTimor-LesteTogoTongaTrinidad and TobagoTunisiaTurkeyTurkmenistanTurks and Caicos IslandsTuvaluUgandaUkraineUnited Arab EmiratesUnited KingdomUnited StatesUpper middle incomeUruguayUzbekistanVanuatuVenezuela, RBVietnamVirgin Islands (U.S.)West Bank and GazaWorldYemen, Rep.ZambiaZimbabwe Timeline:
This timeline shows a graph from 1961 to 2016 of Nepal. No data until 1960. Number of actual observations by date: 56.
Source name:
World Development Indicators
Source organization:
Derived from total population. Population source: (1) United Nations Population Division. World Population Prospects, (2) United Nations Statistical Division. Population and Vital Statistics Report (various years), (3) Census reports and other statistical
Categories, topics:
Climate Change, Health
Last updated:
apr 23, 2017
Indicators value changes by year
At the date of observation
Value
Absolute change
Change from previous value
jan 1, 1961
1.561
+1.561
0.0%
jan 1, 1962
1.561
0.0
-0.02%
jan 1, 1963
1.573
+0.012
0.75%
jan 1, 1964
1.601
+0.029
1.84%
jan 1, 1965
1.65
+0.048
3.01%
jan 1, 1966
1.711
+0.061
3.72%
jan 1, 1967
1.778
+0.067
3.93%
jan 1, 1968
1.843
+0.064
3.63%
jan 1, 1969
1.901
+0.058
3.15%
jan 1, 1970
1.949
+0.048
2.52%
jan 1, 1971
1.989
+0.04
2.06%
jan 1, 1972
2.027
+0.038
1.92%
jan 1, 1973
2.066
+0.039
1.91%
jan 1, 1974
2.102
+0.036
1.74%
jan 1, 1975
2.135
+0.033
1.59%
jan 1, 1976
2.166
+0.031
1.44%
jan 1, 1977
2.193
+0.027
1.26%
jan 1, 1978
2.217
+0.024
1.11%
jan 1, 1979
2.24
+0.023
1.02%
jan 1, 1980
2.261
+0.021
0.95%
jan 1, 1981
2.28
+0.019
0.85%
jan 1, 1982
2.305
+0.025
1.08%
jan 1, 1983
2.327
+0.022
0.94%
jan 1, 1984
2.331
+0.004
0.16%
jan 1, 1985
2.312
-0.019
-0.8%
jan 1, 1986
2.283
-0.029
-1.26%
jan 1, 1987
2.234
-0.049
-2.13%
jan 1, 1988
2.2
-0.034
-1.53%
jan 1, 1989
2.225
+0.025
1.14%
jan 1, 1990
2.325
+0.1
4.49%
jan 1, 1991
2.465
+0.14
6.01%
jan 1, 1992
2.61
+0.146
5.91%
jan 1, 1993
2.709
+0.099
3.78%
jan 1, 1994
2.73
+0.021
0.79%
jan 1, 1995
2.656
-0.074
-2.73%
jan 1, 1996
2.516
-0.14
-5.27%
jan 1, 1997
2.364
-0.152
-6.06%
jan 1, 1998
2.225
-0.139
-5.88%
jan 1, 1999
2.082
-0.142
-6.39%
jan 1, 2000
1.943
-0.14
-6.71%
jan 1, 2001
1.807
-0.136
-6.99%
jan 1, 2002
1.674
-0.133
-7.34%
jan 1, 2003
1.546
-0.129
-7.68%
jan 1, 2004
1.425
-0.12
-7.79%
jan 1, 2005
1.315
-0.11
-7.72%
jan 1, 2006
1.218
-0.097
-7.41%
jan 1, 2007
1.121
-0.097
-7.96%
jan 1, 2008
1.039
-0.082
-7.34%
jan 1, 2009
0.999
-0.04
-3.85%
jan 1, 2010
1.011
+0.012
1.24%
jan 1, 2011
1.059
+0.049
4.8%
jan 1, 2012
1.122
+0.063
5.93%
jan 1, 2013
1.175
+0.053
4.71%
jan 1, 2014
1.209
+0.034
2.87%
jan 1, 2015
1.213
+0.004
0.36%
jan 1, 2016
1.196
-0.017
-1.42%
Ranking of countries by current statistics by years


Comments: