29
/
en
AIzaSyAYiBZKx7MnpbEhh9jyipgxe19OcubqV5w
April 1, 2024
53728
Other small states
OSS
false
2
1
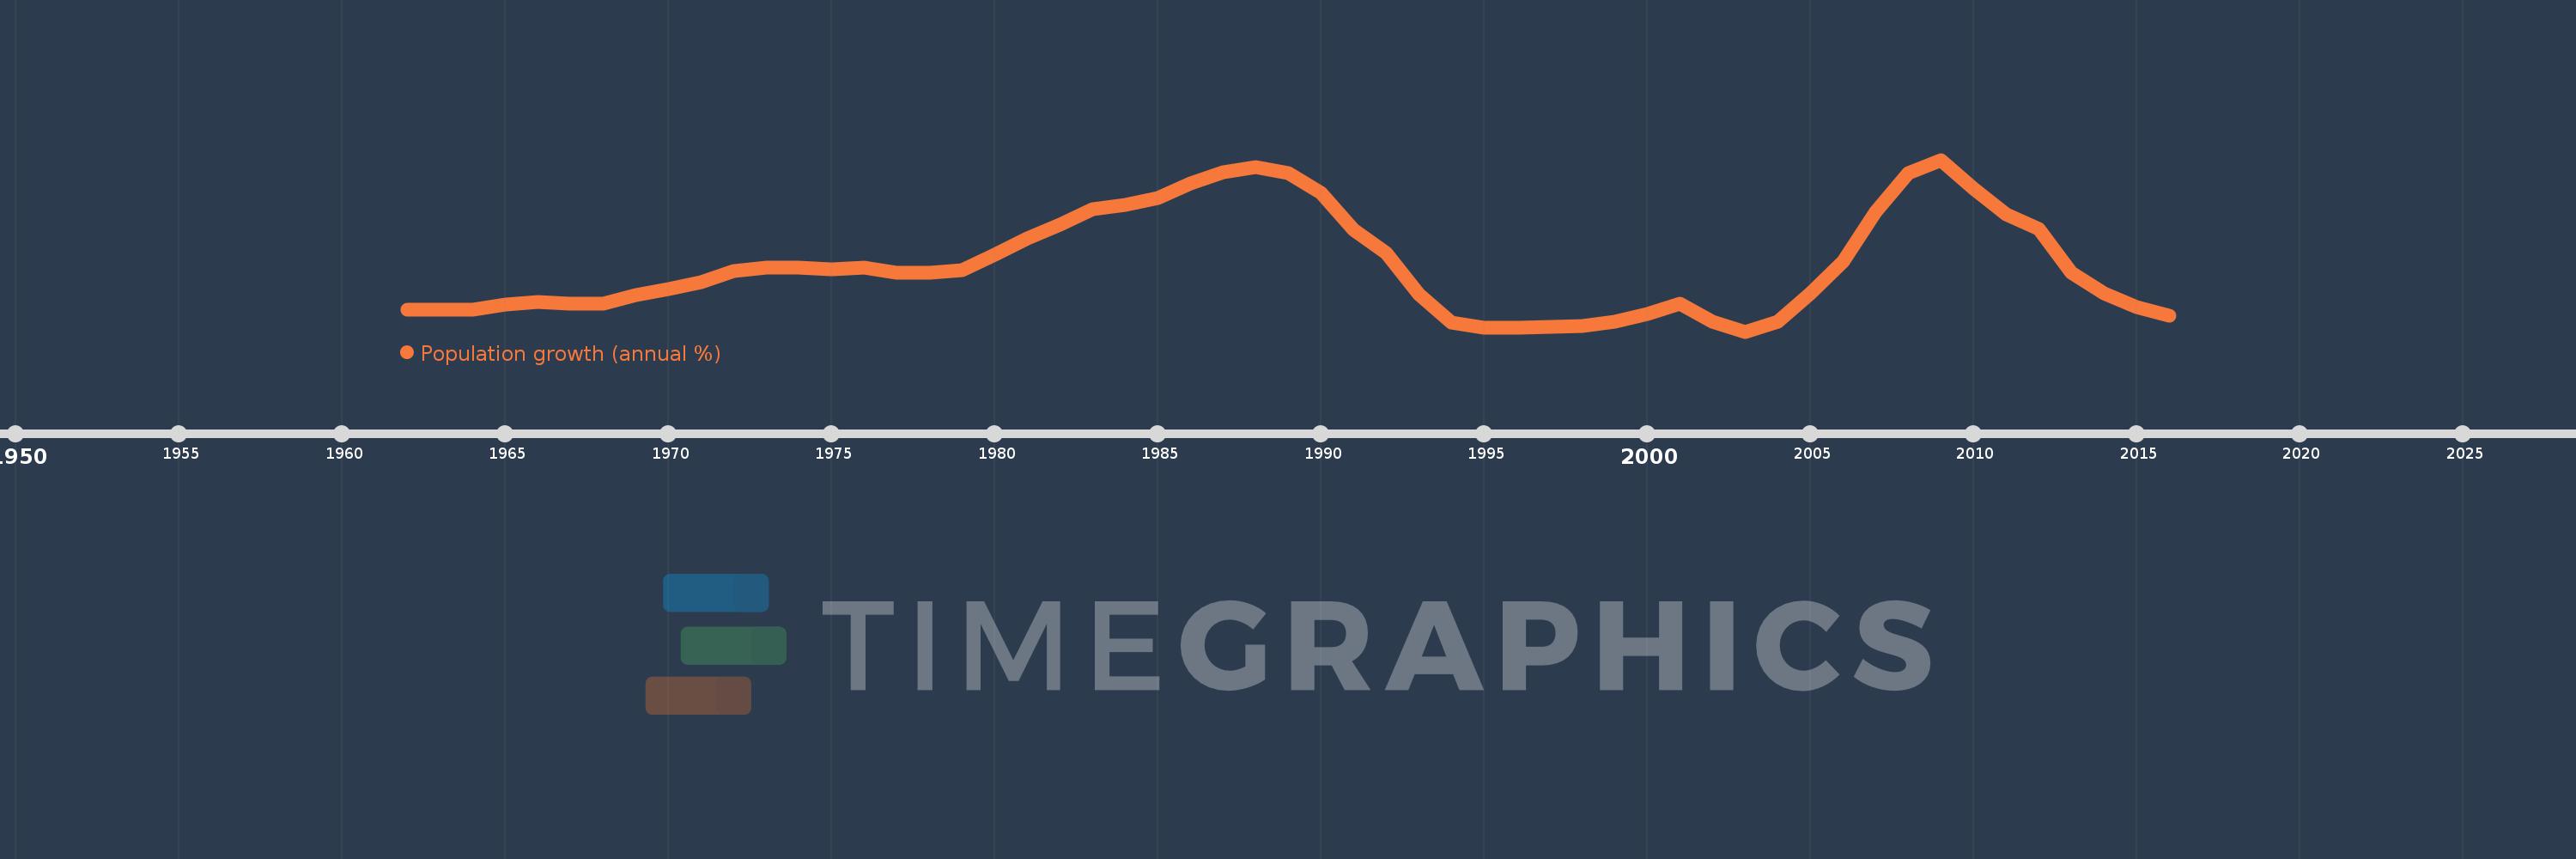
Population growth (annual %)
2016,2015,2014,2013,2012,2011,2010,2009,2008,2007,2006,2005,2004,2003,2002,2001,2000,1999,1998,1997,1996,1995,1994,1993,1992,1991,1990,1989,1988,1987,1986,1985,1984,1983,1982,1981,1980,1979,1978,1977,1976,1975,1974,1973,1972,1971,1970,1969,1968,1967,1966,1965,1964,1963,1962
This statistics in other country:
AfghanistanAlbaniaAlgeriaAmerican SamoaAndorraAngolaAntigua and BarbudaArab WorldArgentinaArmeniaArubaAustraliaAustriaAzerbaijanBahamas, TheBahrainBangladeshBarbadosBelarusBelgiumBelizeBeninBermudaBhutanBoliviaBosnia and HerzegovinaBotswanaBrazilBritish Virgin IslandsBrunei DarussalamBulgariaBurkina FasoBurundiCabo VerdeCambodiaCameroonCanadaCaribbean small statesCayman IslandsCentral African RepublicCentral Europe and the BalticsChadChannel IslandsChileChinaColombiaComorosCongo, Dem. Rep.Congo, Rep.Costa RicaCote d'IvoireCroatiaCubaCuracaoCyprusCzech RepublicDenmarkDjiboutiDominicaDominican RepublicEarly-demographic dividendEast Asia & PacificEast Asia & Pacific (excluding high income)East Asia & Pacific (IDA & IBRD countries)EcuadorEgypt, Arab Rep.El SalvadorEquatorial GuineaEritreaEstoniaEthiopiaEuro areaEurope & Central AsiaEurope & Central Asia (excluding high income)Europe & Central Asia (IDA & IBRD countries)European UnionFaroe IslandsFijiFinlandFragile and conflict affected situationsFranceFrench PolynesiaGabonGambia, TheGeorgiaGermanyGhanaGibraltarGreeceGreenlandGrenadaGuamGuatemalaGuineaGuinea-BissauGuyanaHaitiHeavily indebted poor countries (HIPC)High incomeHondurasHong Kong SAR, ChinaHungaryIBRD onlyIcelandIDA & IBRD totalIDA blendIDA onlyIDA totalIndiaIndonesiaIran, Islamic Rep.IraqIrelandIsle of ManIsraelItalyJamaicaJapanJordanKazakhstanKenyaKiribatiKorea, Dem. People’s Rep.Korea, Rep.KosovoKuwaitKyrgyz RepublicLao PDRLate-demographic dividendLatin America & Caribbean Latin America & Caribbean (excluding high income)Latin America & the Caribbean (IDA & IBRD countries)LatviaLeast developed countries: UN classificationLebanonLesothoLiberiaLibyaLiechtensteinLithuaniaLow & middle incomeLow incomeLower middle incomeLuxembourgMacao SAR, ChinaMacedonia, FYRMadagascarMalawiMalaysiaMaldivesMaliMaltaMarshall IslandsMauritaniaMauritiusMexicoMicronesia, Fed. Sts.Middle East & North AfricaMiddle East & North Africa (excluding high income)Middle East & North Africa (IDA & IBRD countries)Middle incomeMoldovaMonacoMongoliaMontenegroMoroccoMozambiqueMyanmarNamibiaNauruNepalNetherlandsNew CaledoniaNew ZealandNicaraguaNigerNigeriaNorth AmericaNorthern Mariana IslandsNorwayOECD membersOmanOther small statesPacific island small statesPakistanPalauPanamaPapua New GuineaParaguayPeruPhilippinesPolandPortugalPost-demographic dividendPre-demographic dividendPuerto RicoQatarRomaniaRussian FederationRwandaSamoaSan MarinoSao Tome and PrincipeSaudi ArabiaSenegalSerbiaSeychellesSierra LeoneSingaporeSint Maarten (Dutch part)Slovak RepublicSloveniaSmall statesSolomon IslandsSomaliaSouth AfricaSouth AsiaSouth Asia (IDA & IBRD)South SudanSpainSri LankaSt. Kitts and NevisSt. LuciaSt. Martin (French part)St. Vincent and the GrenadinesSub-Saharan Africa Sub-Saharan Africa (excluding high income)Sub-Saharan Africa (IDA & IBRD countries)SudanSurinameSwazilandSwedenSwitzerlandSyrian Arab RepublicTajikistanTanzaniaThailandTimor-LesteTogoTongaTrinidad and TobagoTunisiaTurkeyTurkmenistanTurks and Caicos IslandsTuvaluUgandaUkraineUnited Arab EmiratesUnited KingdomUnited StatesUpper middle incomeUruguayUzbekistanVanuatuVenezuela, RBVietnamVirgin Islands (U.S.)West Bank and GazaWorldYemen, Rep.ZambiaZimbabwe Timeline:
This timeline shows a graph from 1962 to 2016 of Other small states. No data until 1961. Number of actual observations by date: 55.
Source name:
World Development Indicators
Source organization:
Derived from total population. Population source: (1) United Nations Population Division. World Population Prospects, (2) United Nations Statistical Division. Population and Vital Statistics Report (various years), (3) Census reports and other statistical
Categories, topics:
Climate Change, Health
Last updated:
apr 23, 2017
Indicators value changes by year
At the date of observation
Value
Absolute change
Change from previous value
jan 1, 1962
1.834
+1.834
0.0%
jan 1, 1963
1.833
-0.001
-0.06%
jan 1, 1964
1.833
+0.0
0.02%
jan 1, 1965
1.863
+0.03
1.61%
jan 1, 1966
1.878
+0.015
0.81%
jan 1, 1967
1.872
-0.006
-0.32%
jan 1, 1968
1.872
0.0
-0.02%
jan 1, 1969
1.92
+0.048
2.58%
jan 1, 1970
1.956
+0.036
1.87%
jan 1, 1971
1.995
+0.039
1.98%
jan 1, 1972
2.059
+0.064
3.23%
jan 1, 1973
2.081
+0.022
1.08%
jan 1, 1974
2.078
-0.003
-0.14%
jan 1, 1975
2.069
-0.009
-0.43%
jan 1, 1976
2.078
+0.009
0.42%
jan 1, 1977
2.051
-0.028
-1.33%
jan 1, 1978
2.048
-0.002
-0.12%
jan 1, 1979
2.066
+0.018
0.88%
jan 1, 1980
2.155
+0.089
4.29%
jan 1, 1981
2.251
+0.096
4.46%
jan 1, 1982
2.327
+0.076
3.38%
jan 1, 1983
2.417
+0.09
3.86%
jan 1, 1984
2.446
+0.029
1.19%
jan 1, 1985
2.486
+0.04
1.65%
jan 1, 1986
2.569
+0.083
3.35%
jan 1, 1987
2.636
+0.066
2.58%
jan 1, 1988
2.663
+0.027
1.03%
jan 1, 1989
2.631
-0.032
-1.19%
jan 1, 1990
2.514
-0.117
-4.44%
jan 1, 1991
2.297
-0.217
-8.63%
jan 1, 1992
2.166
-0.132
-5.73%
jan 1, 1993
1.925
-0.241
-11.11%
jan 1, 1994
1.762
-0.163
-8.45%
jan 1, 1995
1.73
-0.033
-1.85%
jan 1, 1996
1.732
+0.002
0.12%
jan 1, 1997
1.736
+0.004
0.25%
jan 1, 1998
1.742
+0.006
0.35%
jan 1, 1999
1.763
+0.021
1.2%
jan 1, 2000
1.809
+0.046
2.6%
jan 1, 2001
1.871
+0.061
3.4%
jan 1, 2002
1.764
-0.107
-5.7%
jan 1, 2003
1.708
-0.056
-3.18%
jan 1, 2004
1.767
+0.059
3.44%
jan 1, 2005
1.931
+0.164
9.26%
jan 1, 2006
2.116
+0.185
9.6%
jan 1, 2007
2.404
+0.288
13.62%
jan 1, 2008
2.631
+0.227
9.43%
jan 1, 2009
2.706
+0.075
2.85%
jan 1, 2010
2.539
-0.166
-6.15%
jan 1, 2011
2.387
-0.152
-6.0%
jan 1, 2012
2.306
-0.081
-3.38%
jan 1, 2013
2.05
-0.256
-11.11%
jan 1, 2014
1.929
-0.121
-5.9%
jan 1, 2015
1.849
-0.08
-4.14%
jan 1, 2016
1.802
-0.048
-2.58%
Ranking of countries by current statistics by years


Comments: