29
/
en
AIzaSyAYiBZKx7MnpbEhh9jyipgxe19OcubqV5w
April 1, 2024
129775
Estonia
EST
true
2
1
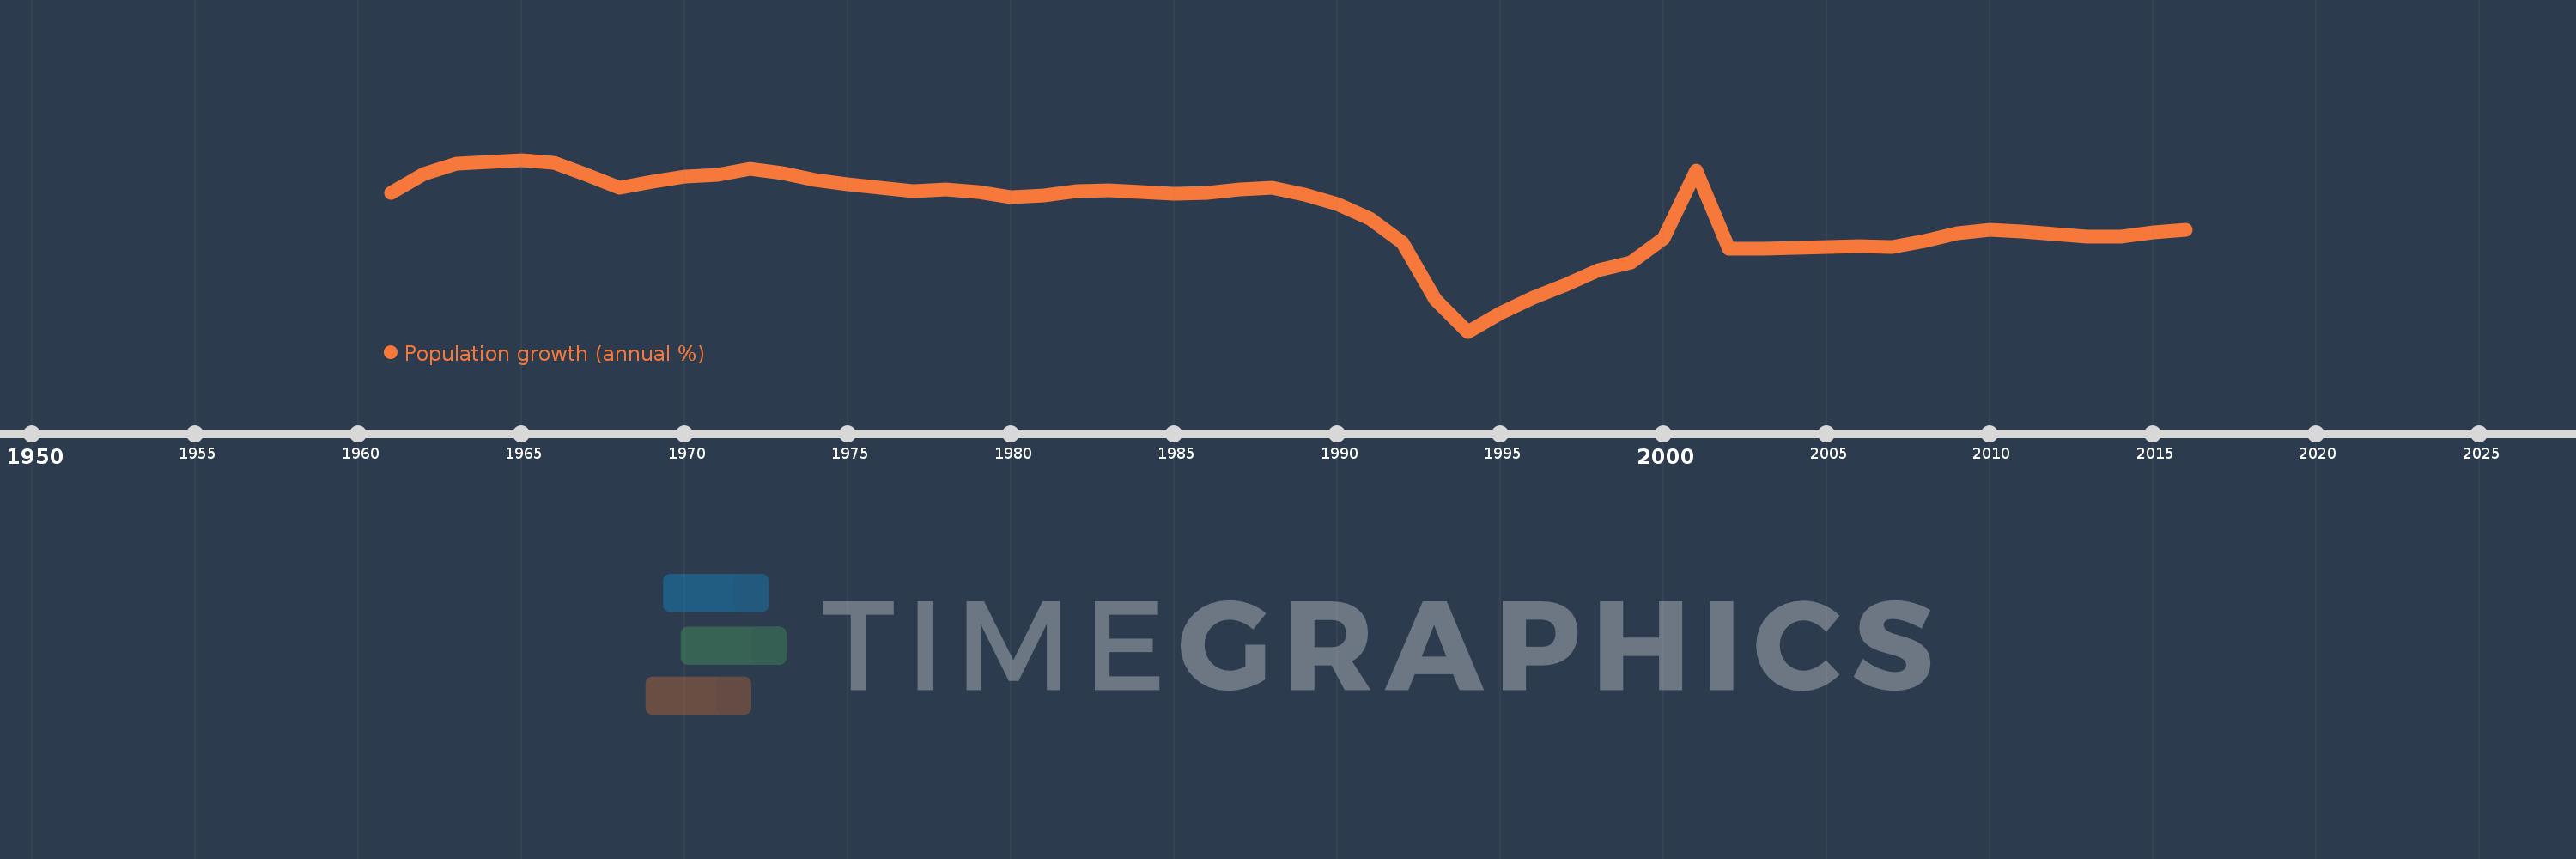
Population growth (annual %)
2016,2015,2014,2013,2012,2011,2010,2009,2008,2007,2006,2005,2004,2003,2002,2001,2000,1999,1998,1997,1996,1995,1994,1993,1992,1991,1990,1989,1988,1987,1986,1985,1984,1983,1982,1981,1980,1979,1978,1977,1976,1975,1974,1973,1972,1971,1970,1969,1968,1967,1966,1965,1964,1963,1962,1961
This statistics in other country:
AfghanistanAlbaniaAlgeriaAmerican SamoaAndorraAngolaAntigua and BarbudaArab WorldArgentinaArmeniaArubaAustraliaAustriaAzerbaijanBahamas, TheBahrainBangladeshBarbadosBelarusBelgiumBelizeBeninBermudaBhutanBoliviaBosnia and HerzegovinaBotswanaBrazilBritish Virgin IslandsBrunei DarussalamBulgariaBurkina FasoBurundiCabo VerdeCambodiaCameroonCanadaCaribbean small statesCayman IslandsCentral African RepublicCentral Europe and the BalticsChadChannel IslandsChileChinaColombiaComorosCongo, Dem. Rep.Congo, Rep.Costa RicaCote d'IvoireCroatiaCubaCuracaoCyprusCzech RepublicDenmarkDjiboutiDominicaDominican RepublicEarly-demographic dividendEast Asia & PacificEast Asia & Pacific (excluding high income)East Asia & Pacific (IDA & IBRD countries)EcuadorEgypt, Arab Rep.El SalvadorEquatorial GuineaEritreaEstoniaEthiopiaEuro areaEurope & Central AsiaEurope & Central Asia (excluding high income)Europe & Central Asia (IDA & IBRD countries)European UnionFaroe IslandsFijiFinlandFragile and conflict affected situationsFranceFrench PolynesiaGabonGambia, TheGeorgiaGermanyGhanaGibraltarGreeceGreenlandGrenadaGuamGuatemalaGuineaGuinea-BissauGuyanaHaitiHeavily indebted poor countries (HIPC)High incomeHondurasHong Kong SAR, ChinaHungaryIBRD onlyIcelandIDA & IBRD totalIDA blendIDA onlyIDA totalIndiaIndonesiaIran, Islamic Rep.IraqIrelandIsle of ManIsraelItalyJamaicaJapanJordanKazakhstanKenyaKiribatiKorea, Dem. People’s Rep.Korea, Rep.KosovoKuwaitKyrgyz RepublicLao PDRLate-demographic dividendLatin America & Caribbean Latin America & Caribbean (excluding high income)Latin America & the Caribbean (IDA & IBRD countries)LatviaLeast developed countries: UN classificationLebanonLesothoLiberiaLibyaLiechtensteinLithuaniaLow & middle incomeLow incomeLower middle incomeLuxembourgMacao SAR, ChinaMacedonia, FYRMadagascarMalawiMalaysiaMaldivesMaliMaltaMarshall IslandsMauritaniaMauritiusMexicoMicronesia, Fed. Sts.Middle East & North AfricaMiddle East & North Africa (excluding high income)Middle East & North Africa (IDA & IBRD countries)Middle incomeMoldovaMonacoMongoliaMontenegroMoroccoMozambiqueMyanmarNamibiaNauruNepalNetherlandsNew CaledoniaNew ZealandNicaraguaNigerNigeriaNorth AmericaNorthern Mariana IslandsNorwayOECD membersOmanOther small statesPacific island small statesPakistanPalauPanamaPapua New GuineaParaguayPeruPhilippinesPolandPortugalPost-demographic dividendPre-demographic dividendPuerto RicoQatarRomaniaRussian FederationRwandaSamoaSan MarinoSao Tome and PrincipeSaudi ArabiaSenegalSerbiaSeychellesSierra LeoneSingaporeSint Maarten (Dutch part)Slovak RepublicSloveniaSmall statesSolomon IslandsSomaliaSouth AfricaSouth AsiaSouth Asia (IDA & IBRD)South SudanSpainSri LankaSt. Kitts and NevisSt. LuciaSt. Martin (French part)St. Vincent and the GrenadinesSub-Saharan Africa Sub-Saharan Africa (excluding high income)Sub-Saharan Africa (IDA & IBRD countries)SudanSurinameSwazilandSwedenSwitzerlandSyrian Arab RepublicTajikistanTanzaniaThailandTimor-LesteTogoTongaTrinidad and TobagoTunisiaTurkeyTurkmenistanTurks and Caicos IslandsTuvaluUgandaUkraineUnited Arab EmiratesUnited KingdomUnited StatesUpper middle incomeUruguayUzbekistanVanuatuVenezuela, RBVietnamVirgin Islands (U.S.)West Bank and GazaWorldYemen, Rep.ZambiaZimbabwe Timeline:
This timeline shows a graph from 1961 to 2016 of Estonia. No data until 1960. Number of actual observations by date: 56.
Source name:
World Development Indicators
Source organization:
Derived from total population. Population source: (1) United Nations Population Division. World Population Prospects, (2) United Nations Statistical Division. Population and Vital Statistics Report (various years), (3) Census reports and other statistical
Categories, topics:
Climate Change, Health
Last updated:
apr 23, 2017
Indicators value changes by year
Minimum:
-2.574
jan 1, 1994
At the date of observation
Value
Absolute change
Change from previous value
jan 1, 1961
0.668
+0.668
0.0%
jan 1, 1962
1.111
+0.443
66.29%
jan 1, 1963
1.342
+0.23
20.71%
jan 1, 1964
1.378
+0.037
2.75%
jan 1, 1965
1.438
+0.059
4.29%
jan 1, 1966
1.359
-0.078
-5.44%
jan 1, 1967
1.078
-0.281
-20.7%
jan 1, 1968
0.788
-0.29
-26.93%
jan 1, 1969
0.926
+0.138
17.53%
jan 1, 1970
1.049
+0.123
13.28%
jan 1, 1971
1.096
+0.047
4.52%
jan 1, 1972
1.233
+0.137
12.52%
jan 1, 1973
1.124
-0.109
-8.88%
jan 1, 1974
0.96
-0.164
-14.58%
jan 1, 1975
0.865
-0.095
-9.87%
jan 1, 1976
0.785
-0.08
-9.22%
jan 1, 1977
0.713
-0.073
-9.26%
jan 1, 1978
0.736
+0.023
3.27%
jan 1, 1979
0.686
-0.05
-6.85%
jan 1, 1980
0.556
-0.129
-18.87%
jan 1, 1981
0.603
+0.047
8.47%
jan 1, 1982
0.705
+0.101
16.8%
jan 1, 1983
0.72
+0.015
2.15%
jan 1, 1984
0.687
-0.033
-4.55%
jan 1, 1985
0.652
-0.035
-5.08%
jan 1, 1986
0.667
+0.015
2.28%
jan 1, 1987
0.744
+0.076
11.46%
jan 1, 1988
0.778
+0.035
4.65%
jan 1, 1989
0.622
-0.156
-20.11%
jan 1, 1990
0.398
-0.223
-35.95%
jan 1, 1991
0.066
-0.332
-83.3%
jan 1, 1992
-0.502
-0.569
-855.24%
jan 1, 1993
-1.824
-1.322
263.27%
jan 1, 1994
-2.574
-0.75
41.12%
jan 1, 1995
-2.139
+0.436
-16.93%
jan 1, 1996
-1.785
+0.353
-16.52%
jan 1, 1997
-1.475
+0.31
-17.37%
jan 1, 1998
-1.141
+0.334
-22.67%
jan 1, 1999
-0.961
+0.18
-15.81%
jan 1, 2000
-0.4
+0.56
-58.34%
jan 1, 2001
1.178
+1.579
-394.46%
jan 1, 2002
-0.637
-1.815
-154.05%
jan 1, 2003
-0.633
+0.004
-0.55%
jan 1, 2004
-0.628
+0.006
-0.92%
jan 1, 2005
-0.598
+0.03
-4.75%
jan 1, 2006
-0.572
+0.026
-4.28%
jan 1, 2007
-0.59
-0.017
3.04%
jan 1, 2008
-0.456
+0.133
-22.63%
jan 1, 2009
-0.268
+0.188
-41.22%
jan 1, 2010
-0.193
+0.075
-28.11%
jan 1, 2011
-0.228
-0.035
18.31%
jan 1, 2012
-0.304
-0.076
33.12%
jan 1, 2013
-0.358
-0.054
17.91%
jan 1, 2014
-0.356
+0.002
-0.57%
jan 1, 2015
-0.262
+0.094
-26.31%
jan 1, 2016
-0.194
+0.068
-26.05%
Ranking of countries by current statistics by years


Comments: