29
/
en
AIzaSyAYiBZKx7MnpbEhh9jyipgxe19OcubqV5w
April 1, 2024
132455
Fiji
FJI
true
2
1
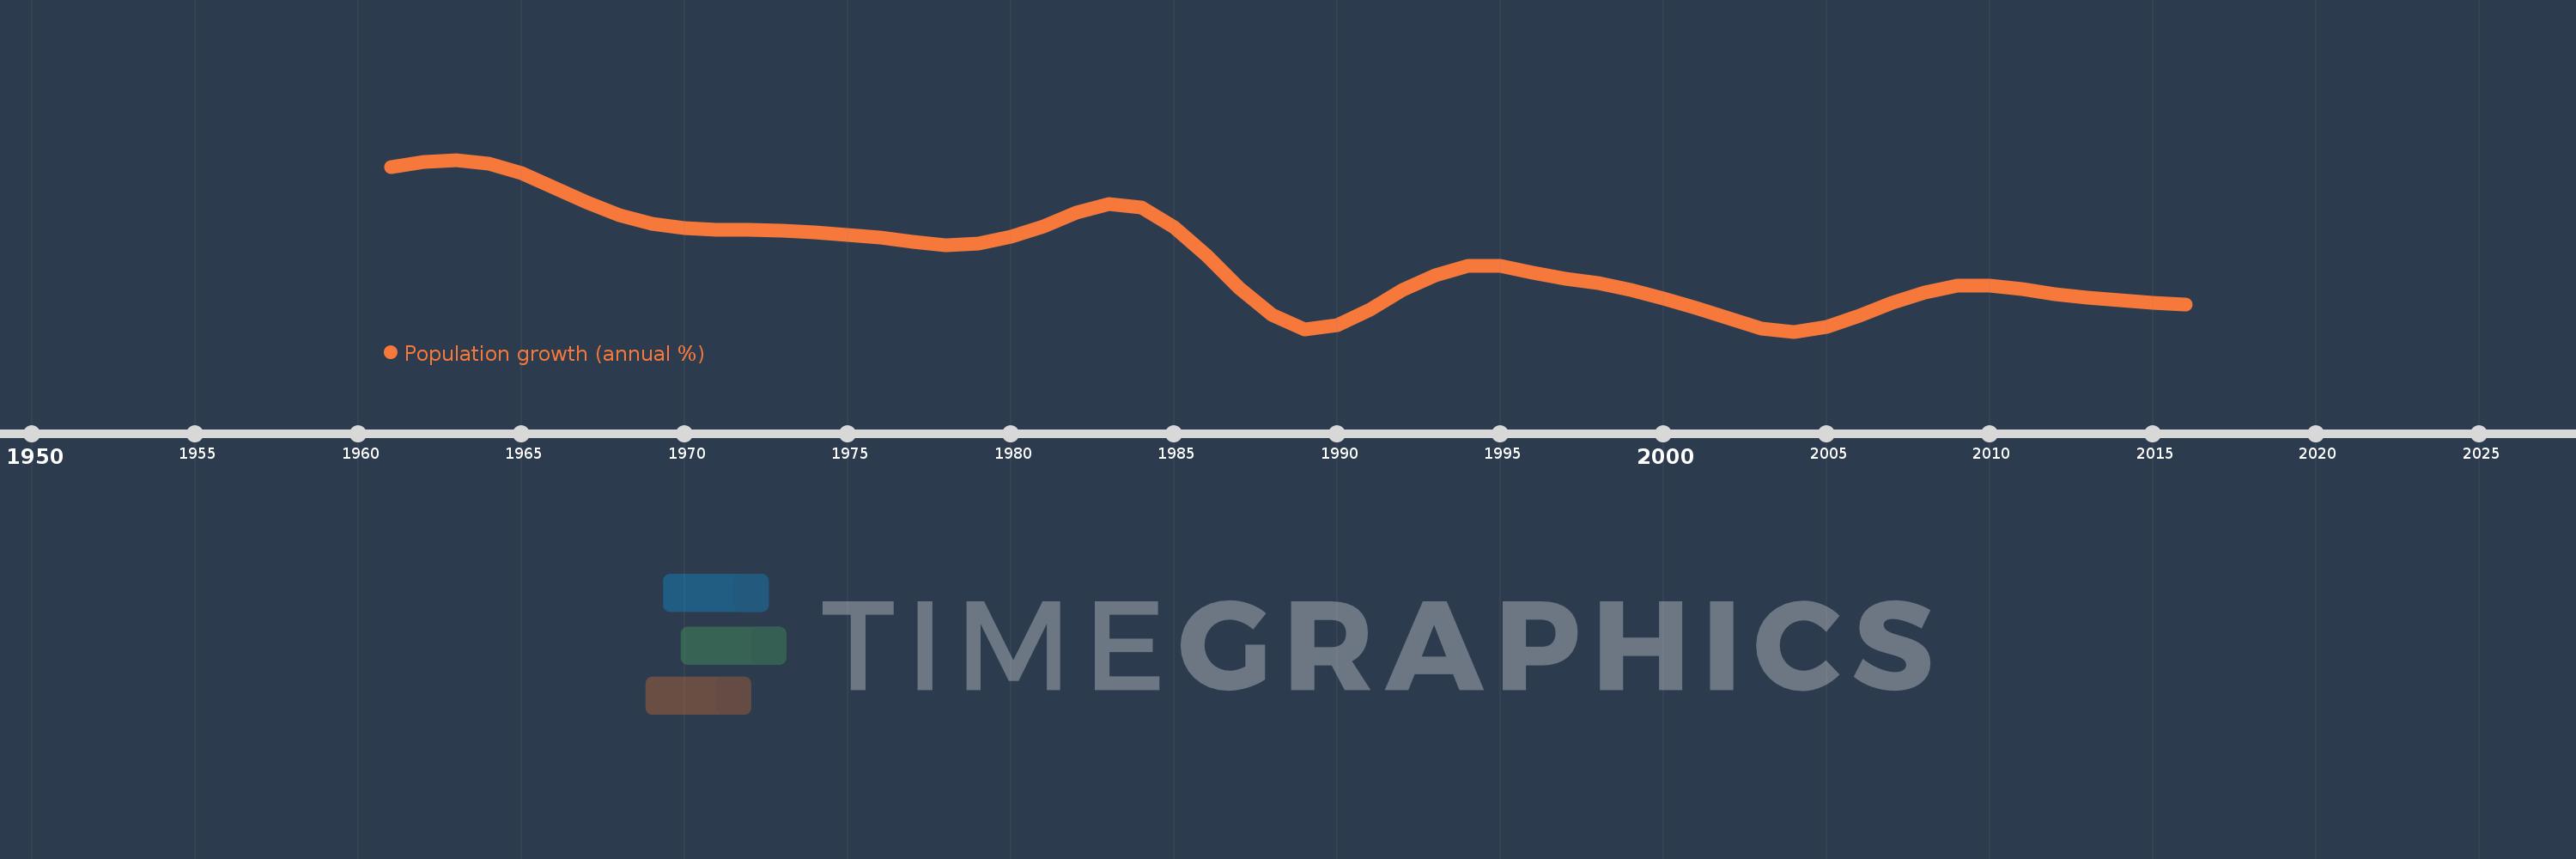
Population growth (annual %)
2016,2015,2014,2013,2012,2011,2010,2009,2008,2007,2006,2005,2004,2003,2002,2001,2000,1999,1998,1997,1996,1995,1994,1993,1992,1991,1990,1989,1988,1987,1986,1985,1984,1983,1982,1981,1980,1979,1978,1977,1976,1975,1974,1973,1972,1971,1970,1969,1968,1967,1966,1965,1964,1963,1962,1961
This statistics in other country:
AfghanistanAlbaniaAlgeriaAmerican SamoaAndorraAngolaAntigua and BarbudaArab WorldArgentinaArmeniaArubaAustraliaAustriaAzerbaijanBahamas, TheBahrainBangladeshBarbadosBelarusBelgiumBelizeBeninBermudaBhutanBoliviaBosnia and HerzegovinaBotswanaBrazilBritish Virgin IslandsBrunei DarussalamBulgariaBurkina FasoBurundiCabo VerdeCambodiaCameroonCanadaCaribbean small statesCayman IslandsCentral African RepublicCentral Europe and the BalticsChadChannel IslandsChileChinaColombiaComorosCongo, Dem. Rep.Congo, Rep.Costa RicaCote d'IvoireCroatiaCubaCuracaoCyprusCzech RepublicDenmarkDjiboutiDominicaDominican RepublicEarly-demographic dividendEast Asia & PacificEast Asia & Pacific (excluding high income)East Asia & Pacific (IDA & IBRD countries)EcuadorEgypt, Arab Rep.El SalvadorEquatorial GuineaEritreaEstoniaEthiopiaEuro areaEurope & Central AsiaEurope & Central Asia (excluding high income)Europe & Central Asia (IDA & IBRD countries)European UnionFaroe IslandsFijiFinlandFragile and conflict affected situationsFranceFrench PolynesiaGabonGambia, TheGeorgiaGermanyGhanaGibraltarGreeceGreenlandGrenadaGuamGuatemalaGuineaGuinea-BissauGuyanaHaitiHeavily indebted poor countries (HIPC)High incomeHondurasHong Kong SAR, ChinaHungaryIBRD onlyIcelandIDA & IBRD totalIDA blendIDA onlyIDA totalIndiaIndonesiaIran, Islamic Rep.IraqIrelandIsle of ManIsraelItalyJamaicaJapanJordanKazakhstanKenyaKiribatiKorea, Dem. People’s Rep.Korea, Rep.KosovoKuwaitKyrgyz RepublicLao PDRLate-demographic dividendLatin America & Caribbean Latin America & Caribbean (excluding high income)Latin America & the Caribbean (IDA & IBRD countries)LatviaLeast developed countries: UN classificationLebanonLesothoLiberiaLibyaLiechtensteinLithuaniaLow & middle incomeLow incomeLower middle incomeLuxembourgMacao SAR, ChinaMacedonia, FYRMadagascarMalawiMalaysiaMaldivesMaliMaltaMarshall IslandsMauritaniaMauritiusMexicoMicronesia, Fed. Sts.Middle East & North AfricaMiddle East & North Africa (excluding high income)Middle East & North Africa (IDA & IBRD countries)Middle incomeMoldovaMonacoMongoliaMontenegroMoroccoMozambiqueMyanmarNamibiaNauruNepalNetherlandsNew CaledoniaNew ZealandNicaraguaNigerNigeriaNorth AmericaNorthern Mariana IslandsNorwayOECD membersOmanOther small statesPacific island small statesPakistanPalauPanamaPapua New GuineaParaguayPeruPhilippinesPolandPortugalPost-demographic dividendPre-demographic dividendPuerto RicoQatarRomaniaRussian FederationRwandaSamoaSan MarinoSao Tome and PrincipeSaudi ArabiaSenegalSerbiaSeychellesSierra LeoneSingaporeSint Maarten (Dutch part)Slovak RepublicSloveniaSmall statesSolomon IslandsSomaliaSouth AfricaSouth AsiaSouth Asia (IDA & IBRD)South SudanSpainSri LankaSt. Kitts and NevisSt. LuciaSt. Martin (French part)St. Vincent and the GrenadinesSub-Saharan Africa Sub-Saharan Africa (excluding high income)Sub-Saharan Africa (IDA & IBRD countries)SudanSurinameSwazilandSwedenSwitzerlandSyrian Arab RepublicTajikistanTanzaniaThailandTimor-LesteTogoTongaTrinidad and TobagoTunisiaTurkeyTurkmenistanTurks and Caicos IslandsTuvaluUgandaUkraineUnited Arab EmiratesUnited KingdomUnited StatesUpper middle incomeUruguayUzbekistanVanuatuVenezuela, RBVietnamVirgin Islands (U.S.)West Bank and GazaWorldYemen, Rep.ZambiaZimbabwe Timeline:
This timeline shows a graph from 1961 to 2016 of Fiji. No data until 1960. Number of actual observations by date: 56.
Source name:
World Development Indicators
Source organization:
Derived from total population. Population source: (1) United Nations Population Division. World Population Prospects, (2) United Nations Statistical Division. Population and Vital Statistics Report (various years), (3) Census reports and other statistical
Categories, topics:
Climate Change, Health
Last updated:
apr 23, 2017
Indicators value changes by year
At the date of observation
Value
Absolute change
Change from previous value
jan 1, 1961
3.342
+3.342
0.0%
jan 1, 1962
3.44
+0.098
2.93%
jan 1, 1963
3.481
+0.041
1.19%
jan 1, 1964
3.412
-0.069
-1.99%
jan 1, 1965
3.213
-0.199
-5.82%
jan 1, 1966
2.938
-0.275
-8.56%
jan 1, 1967
2.647
-0.291
-9.9%
jan 1, 1968
2.402
-0.245
-9.25%
jan 1, 1969
2.225
-0.178
-7.4%
jan 1, 1970
2.136
-0.088
-3.98%
jan 1, 1971
2.11
-0.026
-1.21%
jan 1, 1972
2.105
-0.006
-0.27%
jan 1, 1973
2.087
-0.018
-0.85%
jan 1, 1974
2.06
-0.027
-1.28%
jan 1, 1975
2.015
-0.045
-2.2%
jan 1, 1976
1.963
-0.052
-2.59%
jan 1, 1977
1.878
-0.085
-4.31%
jan 1, 1978
1.811
-0.067
-3.59%
jan 1, 1979
1.837
+0.026
1.44%
jan 1, 1980
1.981
+0.144
7.87%
jan 1, 1981
2.183
+0.201
10.16%
jan 1, 1982
2.442
+0.259
11.86%
jan 1, 1983
2.614
+0.172
7.05%
jan 1, 1984
2.541
-0.073
-2.8%
jan 1, 1985
2.162
-0.379
-14.91%
jan 1, 1986
1.6
-0.562
-25.98%
jan 1, 1987
0.963
-0.637
-39.83%
jan 1, 1988
0.441
-0.522
-54.18%
jan 1, 1989
0.165
-0.276
-62.56%
jan 1, 1990
0.236
+0.071
42.71%
jan 1, 1991
0.551
+0.315
133.66%
jan 1, 1992
0.935
+0.384
69.72%
jan 1, 1993
1.225
+0.29
31.05%
jan 1, 1994
1.399
+0.174
14.21%
jan 1, 1995
1.4
+0.001
0.04%
jan 1, 1996
1.276
-0.124
-8.84%
jan 1, 1997
1.151
-0.124
-9.76%
jan 1, 1998
1.063
-0.089
-7.72%
jan 1, 1999
0.936
-0.127
-11.92%
jan 1, 2000
0.769
-0.167
-17.81%
jan 1, 2001
0.585
-0.185
-24.0%
jan 1, 2002
0.368
-0.217
-37.03%
jan 1, 2003
0.181
-0.187
-50.8%
jan 1, 2004
0.115
-0.067
-36.75%
jan 1, 2005
0.212
+0.097
84.62%
jan 1, 2006
0.423
+0.211
99.77%
jan 1, 2007
0.675
+0.253
59.87%
jan 1, 2008
0.883
+0.208
30.74%
jan 1, 2009
1.01
+0.127
14.42%
jan 1, 2010
1.02
+0.01
0.99%
jan 1, 2011
0.946
-0.074
-7.28%
jan 1, 2012
0.854
-0.092
-9.74%
jan 1, 2013
0.785
-0.069
-8.13%
jan 1, 2014
0.721
-0.063
-8.04%
jan 1, 2015
0.675
-0.046
-6.44%
jan 1, 2016
0.64
-0.035
-5.12%
Ranking of countries by current statistics by years


Comments: