29
/
en
AIzaSyAYiBZKx7MnpbEhh9jyipgxe19OcubqV5w
April 1, 2024
26822
Early-demographic dividend
EAR
false
2
1
Population growth (annual %)
2016,2015,2014,2013,2012,2011,2010,2009,2008,2007,2006,2005,2004,2003,2002,2001,2000,1999,1998,1997,1996,1995,1994,1993,1992,1991,1990,1989,1988,1987,1986,1985,1984,1983,1982,1981,1980,1979,1978,1977,1976,1975,1974,1973,1972,1971,1970,1969,1968,1967,1966,1965,1964,1963,1962
This statistics in other country:
AfghanistanAlbaniaAlgeriaAmerican SamoaAndorraAngolaAntigua and BarbudaArab WorldArgentinaArmeniaArubaAustraliaAustriaAzerbaijanBahamas, TheBahrainBangladeshBarbadosBelarusBelgiumBelizeBeninBermudaBhutanBoliviaBosnia and HerzegovinaBotswanaBrazilBritish Virgin IslandsBrunei DarussalamBulgariaBurkina FasoBurundiCabo VerdeCambodiaCameroonCanadaCaribbean small statesCayman IslandsCentral African RepublicCentral Europe and the BalticsChadChannel IslandsChileChinaColombiaComorosCongo, Dem. Rep.Congo, Rep.Costa RicaCote d'IvoireCroatiaCubaCuracaoCyprusCzech RepublicDenmarkDjiboutiDominicaDominican RepublicEarly-demographic dividendEast Asia & PacificEast Asia & Pacific (excluding high income)East Asia & Pacific (IDA & IBRD countries)EcuadorEgypt, Arab Rep.El SalvadorEquatorial GuineaEritreaEstoniaEthiopiaEuro areaEurope & Central AsiaEurope & Central Asia (excluding high income)Europe & Central Asia (IDA & IBRD countries)European UnionFaroe IslandsFijiFinlandFragile and conflict affected situationsFranceFrench PolynesiaGabonGambia, TheGeorgiaGermanyGhanaGibraltarGreeceGreenlandGrenadaGuamGuatemalaGuineaGuinea-BissauGuyanaHaitiHeavily indebted poor countries (HIPC)High incomeHondurasHong Kong SAR, ChinaHungaryIBRD onlyIcelandIDA & IBRD totalIDA blendIDA onlyIDA totalIndiaIndonesiaIran, Islamic Rep.IraqIrelandIsle of ManIsraelItalyJamaicaJapanJordanKazakhstanKenyaKiribatiKorea, Dem. People’s Rep.Korea, Rep.KosovoKuwaitKyrgyz RepublicLao PDRLate-demographic dividendLatin America & Caribbean Latin America & Caribbean (excluding high income)Latin America & the Caribbean (IDA & IBRD countries)LatviaLeast developed countries: UN classificationLebanonLesothoLiberiaLibyaLiechtensteinLithuaniaLow & middle incomeLow incomeLower middle incomeLuxembourgMacao SAR, ChinaMacedonia, FYRMadagascarMalawiMalaysiaMaldivesMaliMaltaMarshall IslandsMauritaniaMauritiusMexicoMicronesia, Fed. Sts.Middle East & North AfricaMiddle East & North Africa (excluding high income)Middle East & North Africa (IDA & IBRD countries)Middle incomeMoldovaMonacoMongoliaMontenegroMoroccoMozambiqueMyanmarNamibiaNauruNepalNetherlandsNew CaledoniaNew ZealandNicaraguaNigerNigeriaNorth AmericaNorthern Mariana IslandsNorwayOECD membersOmanOther small statesPacific island small statesPakistanPalauPanamaPapua New GuineaParaguayPeruPhilippinesPolandPortugalPost-demographic dividendPre-demographic dividendPuerto RicoQatarRomaniaRussian FederationRwandaSamoaSan MarinoSao Tome and PrincipeSaudi ArabiaSenegalSerbiaSeychellesSierra LeoneSingaporeSint Maarten (Dutch part)Slovak RepublicSloveniaSmall statesSolomon IslandsSomaliaSouth AfricaSouth AsiaSouth Asia (IDA & IBRD)South SudanSpainSri LankaSt. Kitts and NevisSt. LuciaSt. Martin (French part)St. Vincent and the GrenadinesSub-Saharan Africa Sub-Saharan Africa (excluding high income)Sub-Saharan Africa (IDA & IBRD countries)SudanSurinameSwazilandSwedenSwitzerlandSyrian Arab RepublicTajikistanTanzaniaThailandTimor-LesteTogoTongaTrinidad and TobagoTunisiaTurkeyTurkmenistanTurks and Caicos IslandsTuvaluUgandaUkraineUnited Arab EmiratesUnited KingdomUnited StatesUpper middle incomeUruguayUzbekistanVanuatuVenezuela, RBVietnamVirgin Islands (U.S.)West Bank and GazaWorldYemen, Rep.ZambiaZimbabwe Timeline:
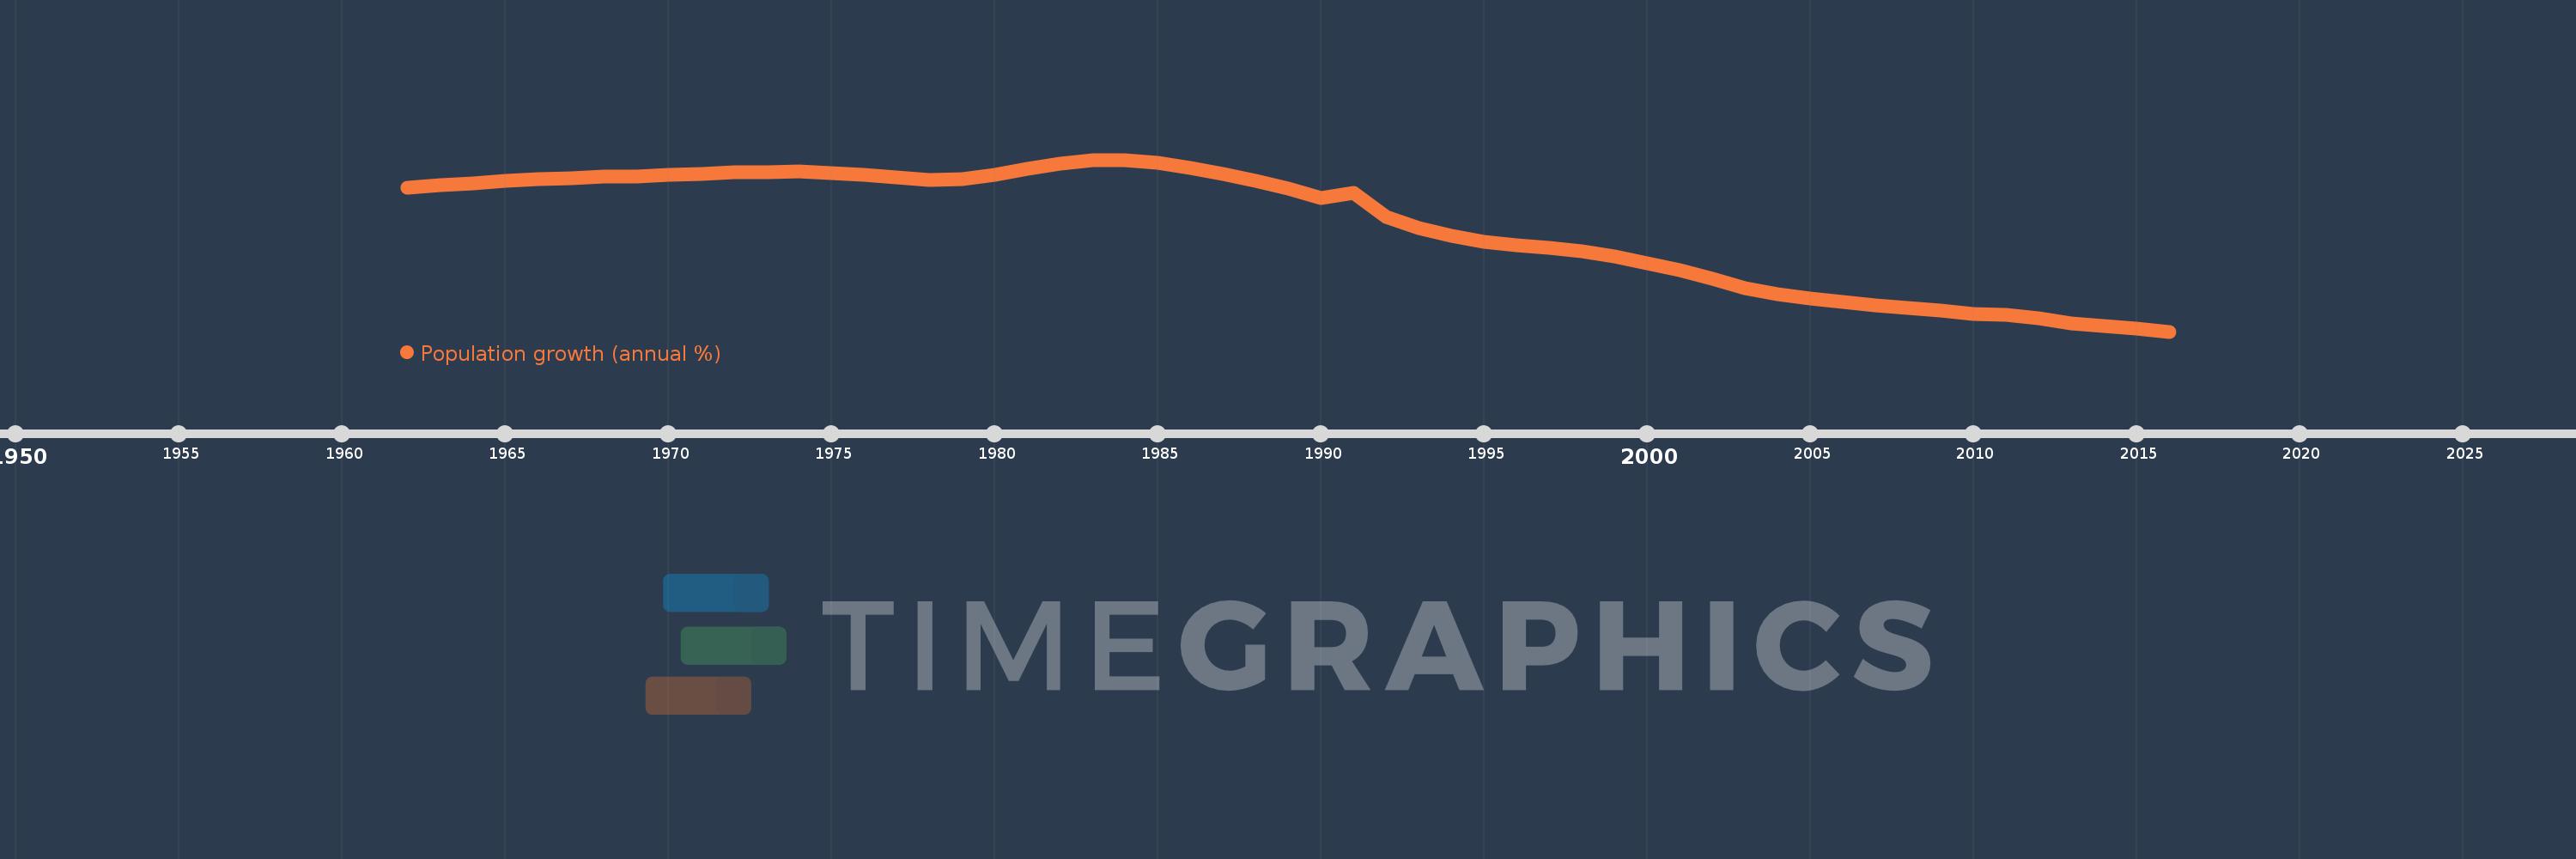
This timeline shows a graph from 1962 to 2016 of Early-demographic dividend. No data until 1961. Number of actual observations by date: 55.
Source name:
World Development Indicators
Source organization:
Derived from total population. Population source: (1) United Nations Population Division. World Population Prospects, (2) United Nations Statistical Division. Population and Vital Statistics Report (various years), (3) Census reports and other statistical
Categories, topics:
Climate Change, Health
Last updated:
apr 23, 2017
Indicators value changes by year
At the date of observation
Value
Absolute change
Change from previous value
jan 1, 1962
2.379
+2.379
0.0%
jan 1, 1963
2.399
+0.021
0.87%
jan 1, 1964
2.412
+0.013
0.53%
jan 1, 1965
2.426
+0.014
0.57%
jan 1, 1966
2.436
+0.01
0.42%
jan 1, 1967
2.443
+0.007
0.29%
jan 1, 1968
2.455
+0.012
0.51%
jan 1, 1969
2.457
+0.002
0.08%
jan 1, 1970
2.466
+0.008
0.33%
jan 1, 1971
2.473
+0.008
0.32%
jan 1, 1972
2.482
+0.008
0.34%
jan 1, 1973
2.485
+0.003
0.13%
jan 1, 1974
2.488
+0.003
0.11%
jan 1, 1975
2.477
-0.01
-0.41%
jan 1, 1976
2.465
-0.012
-0.5%
jan 1, 1977
2.448
-0.017
-0.67%
jan 1, 1978
2.435
-0.013
-0.53%
jan 1, 1979
2.439
+0.004
0.17%
jan 1, 1980
2.467
+0.028
1.13%
jan 1, 1981
2.505
+0.038
1.53%
jan 1, 1982
2.541
+0.036
1.44%
jan 1, 1983
2.564
+0.023
0.91%
jan 1, 1984
2.568
+0.004
0.17%
jan 1, 1985
2.548
-0.02
-0.8%
jan 1, 1986
2.512
-0.036
-1.41%
jan 1, 1987
2.471
-0.041
-1.62%
jan 1, 1988
2.43
-0.041
-1.66%
jan 1, 1989
2.378
-0.052
-2.15%
jan 1, 1990
2.314
-0.064
-2.69%
jan 1, 1991
2.345
+0.031
1.36%
jan 1, 1992
2.184
-0.162
-6.89%
jan 1, 1993
2.114
-0.07
-3.19%
jan 1, 1994
2.059
-0.055
-2.58%
jan 1, 1995
2.022
-0.038
-1.83%
jan 1, 1996
1.998
-0.023
-1.16%
jan 1, 1997
1.982
-0.017
-0.83%
jan 1, 1998
1.959
-0.023
-1.16%
jan 1, 1999
1.923
-0.036
-1.83%
jan 1, 2000
1.876
-0.047
-2.43%
jan 1, 2001
1.83
-0.046
-2.43%
jan 1, 2002
1.77
-0.06
-3.3%
jan 1, 2003
1.708
-0.062
-3.51%
jan 1, 2004
1.67
-0.038
-2.23%
jan 1, 2005
1.64
-0.03
-1.77%
jan 1, 2006
1.617
-0.023
-1.4%
jan 1, 2007
1.596
-0.021
-1.28%
jan 1, 2008
1.576
-0.02
-1.25%
jan 1, 2009
1.557
-0.019
-1.2%
jan 1, 2010
1.539
-0.019
-1.19%
jan 1, 2011
1.529
-0.01
-0.65%
jan 1, 2012
1.508
-0.021
-1.36%
jan 1, 2013
1.476
-0.032
-2.11%
jan 1, 2014
1.457
-0.019
-1.27%
jan 1, 2015
1.439
-0.018
-1.27%
jan 1, 2016
1.419
-0.02
-1.36%
Ranking of countries by current statistics by years


Comments: