29
/
en
AIzaSyAYiBZKx7MnpbEhh9jyipgxe19OcubqV5w
April 1, 2024
226300
Portugal
PRT
true
2
1
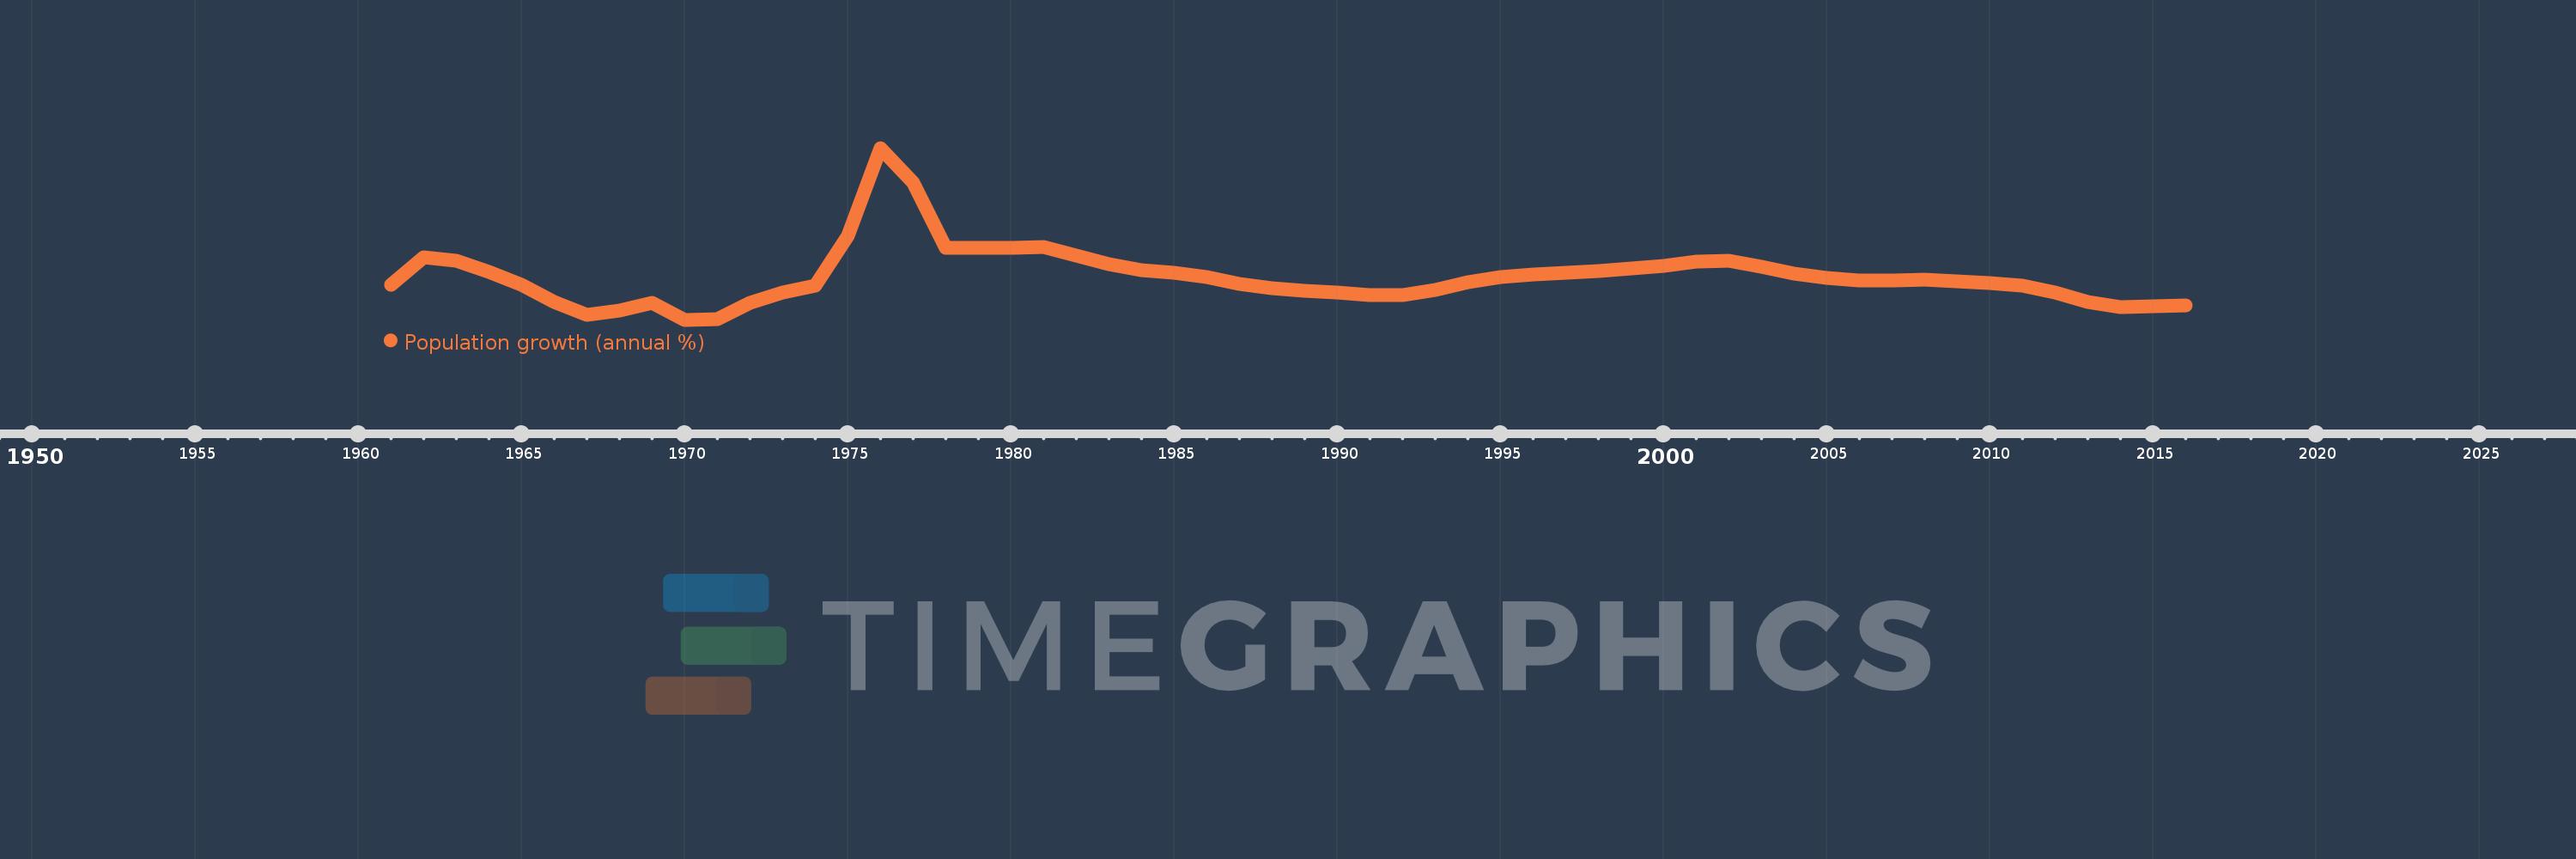
Population growth (annual %)
2016,2015,2014,2013,2012,2011,2010,2009,2008,2007,2006,2005,2004,2003,2002,2001,2000,1999,1998,1997,1996,1995,1994,1993,1992,1991,1990,1989,1988,1987,1986,1985,1984,1983,1982,1981,1980,1979,1978,1977,1976,1975,1974,1973,1972,1971,1970,1969,1968,1967,1966,1965,1964,1963,1962,1961
This statistics in other country:
AfghanistanAlbaniaAlgeriaAmerican SamoaAndorraAngolaAntigua and BarbudaArab WorldArgentinaArmeniaArubaAustraliaAustriaAzerbaijanBahamas, TheBahrainBangladeshBarbadosBelarusBelgiumBelizeBeninBermudaBhutanBoliviaBosnia and HerzegovinaBotswanaBrazilBritish Virgin IslandsBrunei DarussalamBulgariaBurkina FasoBurundiCabo VerdeCambodiaCameroonCanadaCaribbean small statesCayman IslandsCentral African RepublicCentral Europe and the BalticsChadChannel IslandsChileChinaColombiaComorosCongo, Dem. Rep.Congo, Rep.Costa RicaCote d'IvoireCroatiaCubaCuracaoCyprusCzech RepublicDenmarkDjiboutiDominicaDominican RepublicEarly-demographic dividendEast Asia & PacificEast Asia & Pacific (excluding high income)East Asia & Pacific (IDA & IBRD countries)EcuadorEgypt, Arab Rep.El SalvadorEquatorial GuineaEritreaEstoniaEthiopiaEuro areaEurope & Central AsiaEurope & Central Asia (excluding high income)Europe & Central Asia (IDA & IBRD countries)European UnionFaroe IslandsFijiFinlandFragile and conflict affected situationsFranceFrench PolynesiaGabonGambia, TheGeorgiaGermanyGhanaGibraltarGreeceGreenlandGrenadaGuamGuatemalaGuineaGuinea-BissauGuyanaHaitiHeavily indebted poor countries (HIPC)High incomeHondurasHong Kong SAR, ChinaHungaryIBRD onlyIcelandIDA & IBRD totalIDA blendIDA onlyIDA totalIndiaIndonesiaIran, Islamic Rep.IraqIrelandIsle of ManIsraelItalyJamaicaJapanJordanKazakhstanKenyaKiribatiKorea, Dem. People’s Rep.Korea, Rep.KosovoKuwaitKyrgyz RepublicLao PDRLate-demographic dividendLatin America & Caribbean Latin America & Caribbean (excluding high income)Latin America & the Caribbean (IDA & IBRD countries)LatviaLeast developed countries: UN classificationLebanonLesothoLiberiaLibyaLiechtensteinLithuaniaLow & middle incomeLow incomeLower middle incomeLuxembourgMacao SAR, ChinaMacedonia, FYRMadagascarMalawiMalaysiaMaldivesMaliMaltaMarshall IslandsMauritaniaMauritiusMexicoMicronesia, Fed. Sts.Middle East & North AfricaMiddle East & North Africa (excluding high income)Middle East & North Africa (IDA & IBRD countries)Middle incomeMoldovaMonacoMongoliaMontenegroMoroccoMozambiqueMyanmarNamibiaNauruNepalNetherlandsNew CaledoniaNew ZealandNicaraguaNigerNigeriaNorth AmericaNorthern Mariana IslandsNorwayOECD membersOmanOther small statesPacific island small statesPakistanPalauPanamaPapua New GuineaParaguayPeruPhilippinesPolandPortugalPost-demographic dividendPre-demographic dividendPuerto RicoQatarRomaniaRussian FederationRwandaSamoaSan MarinoSao Tome and PrincipeSaudi ArabiaSenegalSerbiaSeychellesSierra LeoneSingaporeSint Maarten (Dutch part)Slovak RepublicSloveniaSmall statesSolomon IslandsSomaliaSouth AfricaSouth AsiaSouth Asia (IDA & IBRD)South SudanSpainSri LankaSt. Kitts and NevisSt. LuciaSt. Martin (French part)St. Vincent and the GrenadinesSub-Saharan Africa Sub-Saharan Africa (excluding high income)Sub-Saharan Africa (IDA & IBRD countries)SudanSurinameSwazilandSwedenSwitzerlandSyrian Arab RepublicTajikistanTanzaniaThailandTimor-LesteTogoTongaTrinidad and TobagoTunisiaTurkeyTurkmenistanTurks and Caicos IslandsTuvaluUgandaUkraineUnited Arab EmiratesUnited KingdomUnited StatesUpper middle incomeUruguayUzbekistanVanuatuVenezuela, RBVietnamVirgin Islands (U.S.)West Bank and GazaWorldYemen, Rep.ZambiaZimbabwe Timeline:
This timeline shows a graph from 1961 to 2016 of Portugal. No data until 1960. Number of actual observations by date: 56.
Source name:
World Development Indicators
Source organization:
Derived from total population. Population source: (1) United Nations Population Division. World Population Prospects, (2) United Nations Statistical Division. Population and Vital Statistics Report (various years), (3) Census reports and other statistical
Categories, topics:
Climate Change, Health
Last updated:
apr 23, 2017
Indicators value changes by year
Minimum:
-0.897
jan 1, 1970
At the date of observation
Value
Absolute change
Change from previous value
jan 1, 1961
0.049
+0.049
0.0%
jan 1, 1962
0.805
+0.756
1.55K%
jan 1, 1963
0.722
-0.083
-10.37%
jan 1, 1964
0.404
-0.318
-44.08%
jan 1, 1965
0.055
-0.348
-86.26%
jan 1, 1966
-0.408
-0.463
-835.23%
jan 1, 1967
-0.754
-0.346
84.93%
jan 1, 1968
-0.634
+0.12
-15.89%
jan 1, 1969
-0.428
+0.207
-32.58%
jan 1, 1970
-0.897
-0.47
109.85%
jan 1, 1971
-0.886
+0.011
-1.24%
jan 1, 1972
-0.423
+0.463
-52.23%
jan 1, 1973
-0.154
+0.269
-63.56%
jan 1, 1974
0.031
+0.185
-120.05%
jan 1, 1975
1.395
+1.364
4.41K%
jan 1, 1976
3.8
+2.406
172.45%
jan 1, 1977
2.844
-0.956
-25.16%
jan 1, 1978
1.062
-1.782
-62.67%
jan 1, 1979
1.079
+0.017
1.62%
jan 1, 1980
1.072
-0.007
-0.65%
jan 1, 1981
1.081
+0.009
0.88%
jan 1, 1982
0.867
-0.214
-19.82%
jan 1, 1983
0.611
-0.256
-29.5%
jan 1, 1984
0.464
-0.147
-24.11%
jan 1, 1985
0.385
-0.079
-17.12%
jan 1, 1986
0.274
-0.111
-28.87%
jan 1, 1987
0.091
-0.183
-66.75%
jan 1, 1988
-0.027
-0.118
-129.63%
jan 1, 1989
-0.104
-0.077
285.79%
jan 1, 1990
-0.146
-0.042
40.37%
jan 1, 1991
-0.218
-0.072
49.36%
jan 1, 1992
-0.23
-0.013
5.75%
jan 1, 1993
-0.078
+0.153
-66.27%
jan 1, 1994
0.122
+0.2
-257.32%
jan 1, 1995
0.269
+0.147
119.99%
jan 1, 1996
0.346
+0.077
28.66%
jan 1, 1997
0.376
+0.03
8.61%
jan 1, 1998
0.446
+0.07
18.74%
jan 1, 1999
0.505
+0.059
13.2%
jan 1, 2000
0.566
+0.06
11.92%
jan 1, 2001
0.703
+0.137
24.26%
jan 1, 2002
0.705
+0.002
0.34%
jan 1, 2003
0.548
-0.158
-22.34%
jan 1, 2004
0.375
-0.172
-31.45%
jan 1, 2005
0.239
-0.136
-36.3%
jan 1, 2006
0.186
-0.054
-22.41%
jan 1, 2007
0.18
-0.005
-2.8%
jan 1, 2008
0.196
+0.016
8.86%
jan 1, 2009
0.144
-0.052
-26.55%
jan 1, 2010
0.095
-0.049
-33.89%
jan 1, 2011
0.046
-0.049
-51.84%
jan 1, 2012
-0.147
-0.193
-420.38%
jan 1, 2013
-0.405
-0.258
175.64%
jan 1, 2014
-0.549
-0.143
35.37%
jan 1, 2015
-0.539
+0.01
-1.75%
jan 1, 2016
-0.505
+0.034
-6.3%
Ranking of countries by current statistics by years


Comments: