29
/
en
AIzaSyAYiBZKx7MnpbEhh9jyipgxe19OcubqV5w
April 1, 2024
181519
Lithuania
LTU
true
2
1
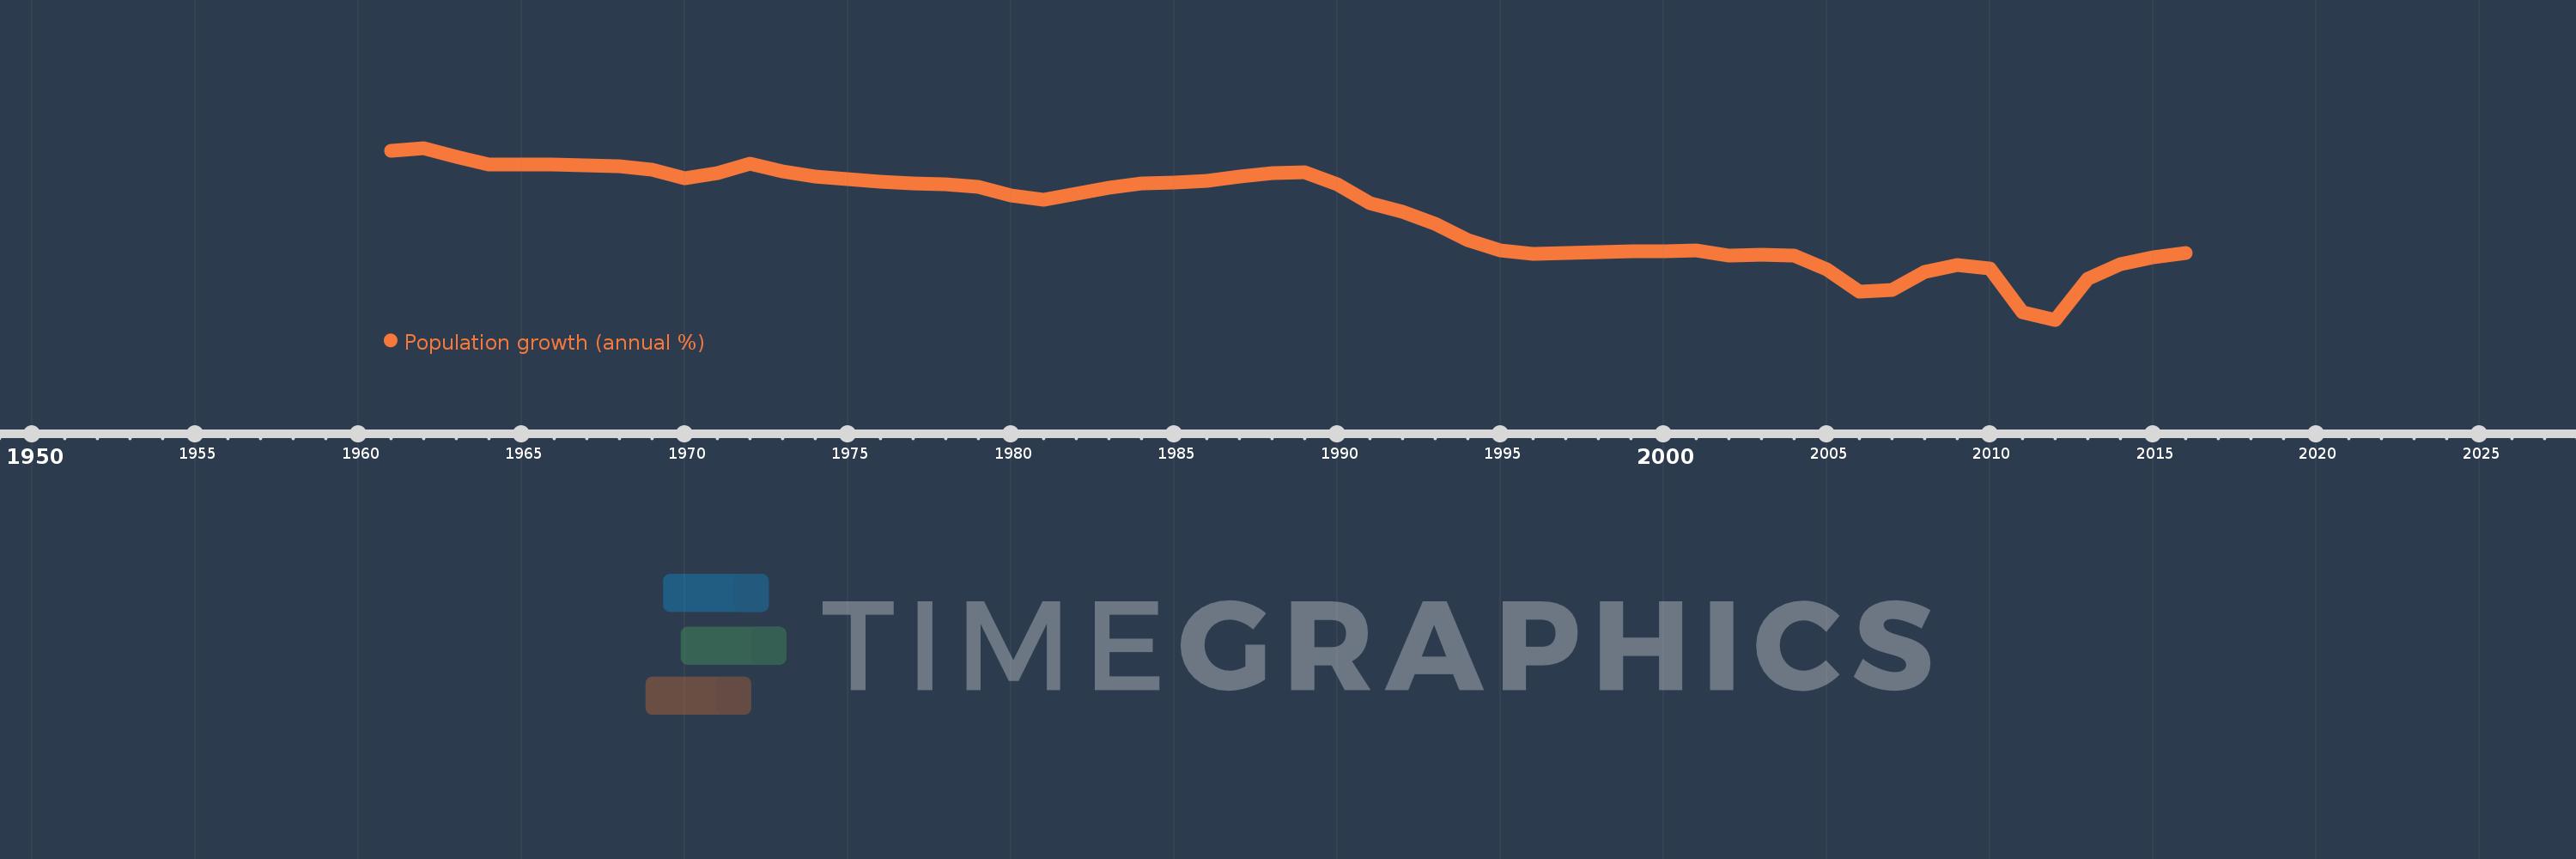
Population growth (annual %)
2016,2015,2014,2013,2012,2011,2010,2009,2008,2007,2006,2005,2004,2003,2002,2001,2000,1999,1998,1997,1996,1995,1994,1993,1992,1991,1990,1989,1988,1987,1986,1985,1984,1983,1982,1981,1980,1979,1978,1977,1976,1975,1974,1973,1972,1971,1970,1969,1968,1967,1966,1965,1964,1963,1962,1961
This statistics in other country:
AfghanistanAlbaniaAlgeriaAmerican SamoaAndorraAngolaAntigua and BarbudaArab WorldArgentinaArmeniaArubaAustraliaAustriaAzerbaijanBahamas, TheBahrainBangladeshBarbadosBelarusBelgiumBelizeBeninBermudaBhutanBoliviaBosnia and HerzegovinaBotswanaBrazilBritish Virgin IslandsBrunei DarussalamBulgariaBurkina FasoBurundiCabo VerdeCambodiaCameroonCanadaCaribbean small statesCayman IslandsCentral African RepublicCentral Europe and the BalticsChadChannel IslandsChileChinaColombiaComorosCongo, Dem. Rep.Congo, Rep.Costa RicaCote d'IvoireCroatiaCubaCuracaoCyprusCzech RepublicDenmarkDjiboutiDominicaDominican RepublicEarly-demographic dividendEast Asia & PacificEast Asia & Pacific (excluding high income)East Asia & Pacific (IDA & IBRD countries)EcuadorEgypt, Arab Rep.El SalvadorEquatorial GuineaEritreaEstoniaEthiopiaEuro areaEurope & Central AsiaEurope & Central Asia (excluding high income)Europe & Central Asia (IDA & IBRD countries)European UnionFaroe IslandsFijiFinlandFragile and conflict affected situationsFranceFrench PolynesiaGabonGambia, TheGeorgiaGermanyGhanaGibraltarGreeceGreenlandGrenadaGuamGuatemalaGuineaGuinea-BissauGuyanaHaitiHeavily indebted poor countries (HIPC)High incomeHondurasHong Kong SAR, ChinaHungaryIBRD onlyIcelandIDA & IBRD totalIDA blendIDA onlyIDA totalIndiaIndonesiaIran, Islamic Rep.IraqIrelandIsle of ManIsraelItalyJamaicaJapanJordanKazakhstanKenyaKiribatiKorea, Dem. People’s Rep.Korea, Rep.KosovoKuwaitKyrgyz RepublicLao PDRLate-demographic dividendLatin America & Caribbean Latin America & Caribbean (excluding high income)Latin America & the Caribbean (IDA & IBRD countries)LatviaLeast developed countries: UN classificationLebanonLesothoLiberiaLibyaLiechtensteinLithuaniaLow & middle incomeLow incomeLower middle incomeLuxembourgMacao SAR, ChinaMacedonia, FYRMadagascarMalawiMalaysiaMaldivesMaliMaltaMarshall IslandsMauritaniaMauritiusMexicoMicronesia, Fed. Sts.Middle East & North AfricaMiddle East & North Africa (excluding high income)Middle East & North Africa (IDA & IBRD countries)Middle incomeMoldovaMonacoMongoliaMontenegroMoroccoMozambiqueMyanmarNamibiaNauruNepalNetherlandsNew CaledoniaNew ZealandNicaraguaNigerNigeriaNorth AmericaNorthern Mariana IslandsNorwayOECD membersOmanOther small statesPacific island small statesPakistanPalauPanamaPapua New GuineaParaguayPeruPhilippinesPolandPortugalPost-demographic dividendPre-demographic dividendPuerto RicoQatarRomaniaRussian FederationRwandaSamoaSan MarinoSao Tome and PrincipeSaudi ArabiaSenegalSerbiaSeychellesSierra LeoneSingaporeSint Maarten (Dutch part)Slovak RepublicSloveniaSmall statesSolomon IslandsSomaliaSouth AfricaSouth AsiaSouth Asia (IDA & IBRD)South SudanSpainSri LankaSt. Kitts and NevisSt. LuciaSt. Martin (French part)St. Vincent and the GrenadinesSub-Saharan Africa Sub-Saharan Africa (excluding high income)Sub-Saharan Africa (IDA & IBRD countries)SudanSurinameSwazilandSwedenSwitzerlandSyrian Arab RepublicTajikistanTanzaniaThailandTimor-LesteTogoTongaTrinidad and TobagoTunisiaTurkeyTurkmenistanTurks and Caicos IslandsTuvaluUgandaUkraineUnited Arab EmiratesUnited KingdomUnited StatesUpper middle incomeUruguayUzbekistanVanuatuVenezuela, RBVietnamVirgin Islands (U.S.)West Bank and GazaWorldYemen, Rep.ZambiaZimbabwe Timeline:
This timeline shows a graph from 1961 to 2016 of Lithuania. No data until 1960. Number of actual observations by date: 56.
Source name:
World Development Indicators
Source organization:
Derived from total population. Population source: (1) United Nations Population Division. World Population Prospects, (2) United Nations Statistical Division. Population and Vital Statistics Report (various years), (3) Census reports and other statistical
Categories, topics:
Climate Change, Health
Last updated:
apr 23, 2017
Indicators value changes by year
Minimum:
-2.258
jan 1, 2012
At the date of observation
Value
Absolute change
Change from previous value
jan 1, 1961
1.55
+1.55
0.0%
jan 1, 1962
1.607
+0.057
3.65%
jan 1, 1963
1.4
-0.207
-12.87%
jan 1, 1964
1.236
-0.164
-11.72%
jan 1, 1965
1.243
+0.007
0.57%
jan 1, 1966
1.227
-0.015
-1.23%
jan 1, 1967
1.224
-0.003
-0.26%
jan 1, 1968
1.201
-0.023
-1.88%
jan 1, 1969
1.125
-0.076
-6.32%
jan 1, 1970
0.92
-0.205
-18.2%
jan 1, 1971
1.036
+0.116
12.58%
jan 1, 1972
1.246
+0.209
20.2%
jan 1, 1973
1.082
-0.164
-13.14%
jan 1, 1974
0.954
-0.128
-11.79%
jan 1, 1975
0.904
-0.051
-5.3%
jan 1, 1976
0.844
-0.06
-6.58%
jan 1, 1977
0.815
-0.029
-3.49%
jan 1, 1978
0.789
-0.026
-3.15%
jan 1, 1979
0.727
-0.062
-7.88%
jan 1, 1980
0.541
-0.186
-25.6%
jan 1, 1981
0.451
-0.09
-16.61%
jan 1, 1982
0.577
+0.126
27.89%
jan 1, 1983
0.703
+0.127
21.94%
jan 1, 1984
0.807
+0.104
14.73%
jan 1, 1985
0.829
+0.022
2.73%
jan 1, 1986
0.86
+0.031
3.69%
jan 1, 1987
0.965
+0.105
12.26%
jan 1, 1988
1.041
+0.076
7.88%
jan 1, 1989
1.064
+0.023
2.2%
jan 1, 1990
0.796
-0.268
-25.2%
jan 1, 1991
0.368
-0.428
-53.76%
jan 1, 1992
0.17
-0.198
-53.77%
jan 1, 1993
-0.109
-0.279
-163.83%
jan 1, 1994
-0.474
-0.366
336.62%
jan 1, 1995
-0.694
-0.22
46.38%
jan 1, 1996
-0.77
-0.076
10.91%
jan 1, 1997
-0.76
+0.009
-1.22%
jan 1, 1998
-0.738
+0.023
-2.96%
jan 1, 1999
-0.724
+0.013
-1.82%
jan 1, 2000
-0.709
+0.015
-2.06%
jan 1, 2001
-0.703
+0.006
-0.86%
jan 1, 2002
-0.824
-0.121
17.15%
jan 1, 2003
-0.803
+0.021
-2.58%
jan 1, 2004
-0.812
-0.01
1.18%
jan 1, 2005
-1.123
-0.311
38.25%
jan 1, 2006
-1.628
-0.505
45.01%
jan 1, 2007
-1.596
+0.032
-1.97%
jan 1, 2008
-1.188
+0.408
-25.58%
jan 1, 2009
-1.028
+0.159
-13.42%
jan 1, 2010
-1.11
-0.082
7.96%
jan 1, 2011
-2.097
-0.987
88.85%
jan 1, 2012
-2.258
-0.162
7.7%
jan 1, 2013
-1.341
+0.917
-40.61%
jan 1, 2014
-1.012
+0.329
-24.54%
jan 1, 2015
-0.86
+0.152
-15.04%
jan 1, 2016
-0.759
+0.101
-11.74%
Ranking of countries by current statistics by years


Comments: