29
/
en
AIzaSyAYiBZKx7MnpbEhh9jyipgxe19OcubqV5w
April 1, 2024
203402
Mozambique
MOZ
true
2
1
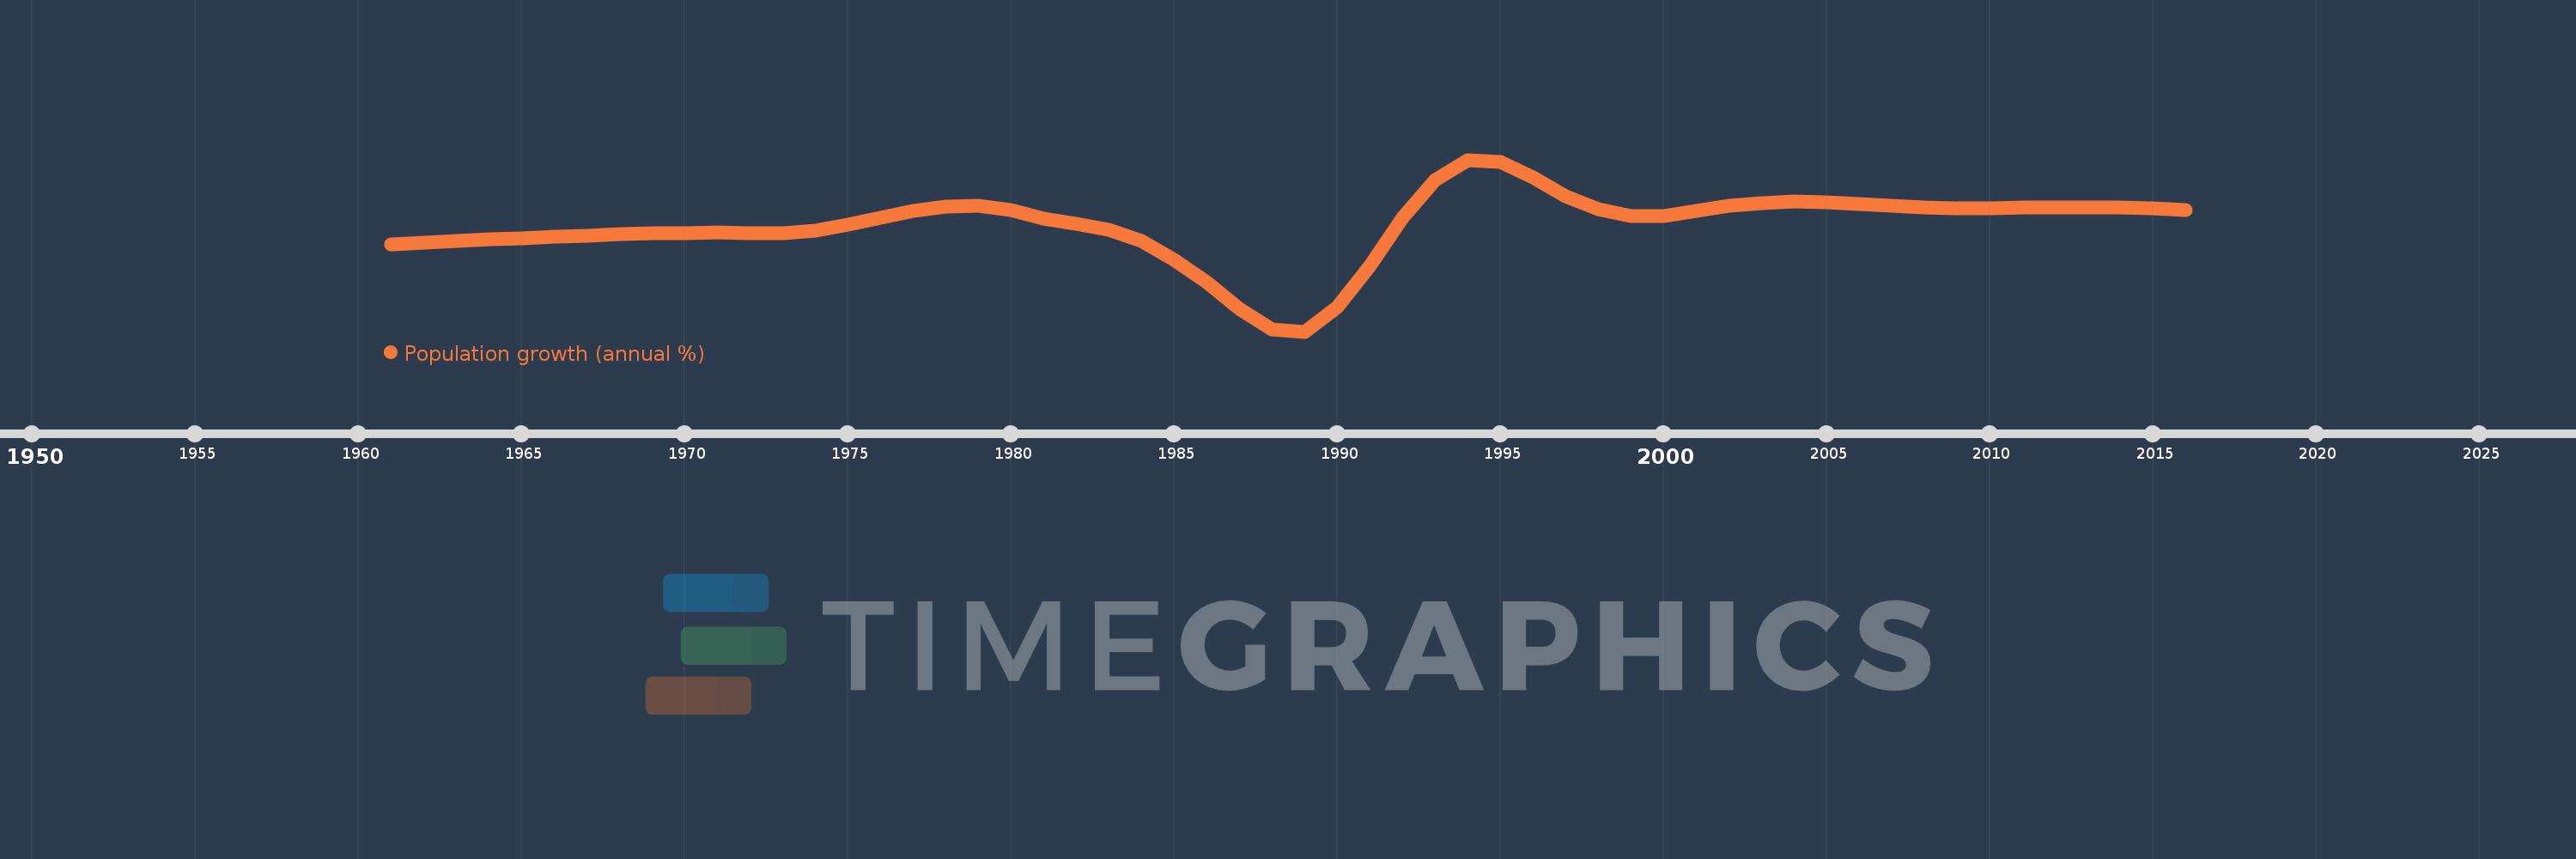
Population growth (annual %)
2016,2015,2014,2013,2012,2011,2010,2009,2008,2007,2006,2005,2004,2003,2002,2001,2000,1999,1998,1997,1996,1995,1994,1993,1992,1991,1990,1989,1988,1987,1986,1985,1984,1983,1982,1981,1980,1979,1978,1977,1976,1975,1974,1973,1972,1971,1970,1969,1968,1967,1966,1965,1964,1963,1962,1961
This statistics in other country:
AfghanistanAlbaniaAlgeriaAmerican SamoaAndorraAngolaAntigua and BarbudaArab WorldArgentinaArmeniaArubaAustraliaAustriaAzerbaijanBahamas, TheBahrainBangladeshBarbadosBelarusBelgiumBelizeBeninBermudaBhutanBoliviaBosnia and HerzegovinaBotswanaBrazilBritish Virgin IslandsBrunei DarussalamBulgariaBurkina FasoBurundiCabo VerdeCambodiaCameroonCanadaCaribbean small statesCayman IslandsCentral African RepublicCentral Europe and the BalticsChadChannel IslandsChileChinaColombiaComorosCongo, Dem. Rep.Congo, Rep.Costa RicaCote d'IvoireCroatiaCubaCuracaoCyprusCzech RepublicDenmarkDjiboutiDominicaDominican RepublicEarly-demographic dividendEast Asia & PacificEast Asia & Pacific (excluding high income)East Asia & Pacific (IDA & IBRD countries)EcuadorEgypt, Arab Rep.El SalvadorEquatorial GuineaEritreaEstoniaEthiopiaEuro areaEurope & Central AsiaEurope & Central Asia (excluding high income)Europe & Central Asia (IDA & IBRD countries)European UnionFaroe IslandsFijiFinlandFragile and conflict affected situationsFranceFrench PolynesiaGabonGambia, TheGeorgiaGermanyGhanaGibraltarGreeceGreenlandGrenadaGuamGuatemalaGuineaGuinea-BissauGuyanaHaitiHeavily indebted poor countries (HIPC)High incomeHondurasHong Kong SAR, ChinaHungaryIBRD onlyIcelandIDA & IBRD totalIDA blendIDA onlyIDA totalIndiaIndonesiaIran, Islamic Rep.IraqIrelandIsle of ManIsraelItalyJamaicaJapanJordanKazakhstanKenyaKiribatiKorea, Dem. People’s Rep.Korea, Rep.KosovoKuwaitKyrgyz RepublicLao PDRLate-demographic dividendLatin America & Caribbean Latin America & Caribbean (excluding high income)Latin America & the Caribbean (IDA & IBRD countries)LatviaLeast developed countries: UN classificationLebanonLesothoLiberiaLibyaLiechtensteinLithuaniaLow & middle incomeLow incomeLower middle incomeLuxembourgMacao SAR, ChinaMacedonia, FYRMadagascarMalawiMalaysiaMaldivesMaliMaltaMarshall IslandsMauritaniaMauritiusMexicoMicronesia, Fed. Sts.Middle East & North AfricaMiddle East & North Africa (excluding high income)Middle East & North Africa (IDA & IBRD countries)Middle incomeMoldovaMonacoMongoliaMontenegroMoroccoMozambiqueMyanmarNamibiaNauruNepalNetherlandsNew CaledoniaNew ZealandNicaraguaNigerNigeriaNorth AmericaNorthern Mariana IslandsNorwayOECD membersOmanOther small statesPacific island small statesPakistanPalauPanamaPapua New GuineaParaguayPeruPhilippinesPolandPortugalPost-demographic dividendPre-demographic dividendPuerto RicoQatarRomaniaRussian FederationRwandaSamoaSan MarinoSao Tome and PrincipeSaudi ArabiaSenegalSerbiaSeychellesSierra LeoneSingaporeSint Maarten (Dutch part)Slovak RepublicSloveniaSmall statesSolomon IslandsSomaliaSouth AfricaSouth AsiaSouth Asia (IDA & IBRD)South SudanSpainSri LankaSt. Kitts and NevisSt. LuciaSt. Martin (French part)St. Vincent and the GrenadinesSub-Saharan Africa Sub-Saharan Africa (excluding high income)Sub-Saharan Africa (IDA & IBRD countries)SudanSurinameSwazilandSwedenSwitzerlandSyrian Arab RepublicTajikistanTanzaniaThailandTimor-LesteTogoTongaTrinidad and TobagoTunisiaTurkeyTurkmenistanTurks and Caicos IslandsTuvaluUgandaUkraineUnited Arab EmiratesUnited KingdomUnited StatesUpper middle incomeUruguayUzbekistanVanuatuVenezuela, RBVietnamVirgin Islands (U.S.)West Bank and GazaWorldYemen, Rep.ZambiaZimbabwe Timeline:
This timeline shows a graph from 1961 to 2016 of Mozambique. No data until 1960. Number of actual observations by date: 56.
Source name:
World Development Indicators
Source organization:
Derived from total population. Population source: (1) United Nations Population Division. World Population Prospects, (2) United Nations Statistical Division. Population and Vital Statistics Report (various years), (3) Census reports and other statistical
Categories, topics:
Climate Change, Health
Last updated:
apr 23, 2017
Indicators value changes by year
Minimum:
-0.139
jan 1, 1989
At the date of observation
Value
Absolute change
Change from previous value
jan 1, 1961
1.939
+1.939
0.0%
jan 1, 1962
1.982
+0.043
2.21%
jan 1, 1963
2.022
+0.04
2.0%
jan 1, 1964
2.057
+0.035
1.72%
jan 1, 1965
2.086
+0.029
1.42%
jan 1, 1966
2.111
+0.026
1.22%
jan 1, 1967
2.141
+0.029
1.38%
jan 1, 1968
2.171
+0.03
1.42%
jan 1, 1969
2.194
+0.023
1.07%
jan 1, 1970
2.208
+0.014
0.66%
jan 1, 1971
2.22
+0.012
0.54%
jan 1, 1972
2.208
-0.013
-0.57%
jan 1, 1973
2.203
-0.005
-0.21%
jan 1, 1974
2.26
+0.057
2.61%
jan 1, 1975
2.396
+0.136
6.0%
jan 1, 1976
2.569
+0.173
7.2%
jan 1, 1977
2.737
+0.168
6.55%
jan 1, 1978
2.842
+0.105
3.83%
jan 1, 1979
2.851
+0.01
0.34%
jan 1, 1980
2.745
-0.106
-3.71%
jan 1, 1981
2.556
-0.189
-6.9%
jan 1, 1982
2.418
-0.138
-5.4%
jan 1, 1983
2.291
-0.127
-5.26%
jan 1, 1984
2.018
-0.273
-11.93%
jan 1, 1985
1.566
-0.452
-22.39%
jan 1, 1986
1.033
-0.533
-34.03%
jan 1, 1987
0.398
-0.635
-61.44%
jan 1, 1988
-0.097
-0.495
-124.36%
jan 1, 1989
-0.139
-0.042
43.1%
jan 1, 1990
0.438
+0.577
-415.78%
jan 1, 1991
1.431
+0.993
226.52%
jan 1, 1992
2.568
+1.137
79.44%
jan 1, 1993
3.468
+0.9
35.03%
jan 1, 1994
3.947
+0.479
13.83%
jan 1, 1995
3.897
-0.05
-1.27%
jan 1, 1996
3.518
-0.379
-9.74%
jan 1, 1997
3.08
-0.438
-12.45%
jan 1, 1998
2.777
-0.303
-9.82%
jan 1, 1999
2.6
-0.177
-6.37%
jan 1, 2000
2.603
+0.003
0.11%
jan 1, 2001
2.722
+0.119
4.57%
jan 1, 2002
2.849
+0.127
4.66%
jan 1, 2003
2.918
+0.069
2.41%
jan 1, 2004
2.952
+0.035
1.2%
jan 1, 2005
2.94
-0.012
-0.41%
jan 1, 2006
2.898
-0.042
-1.43%
jan 1, 2007
2.852
-0.046
-1.6%
jan 1, 2008
2.82
-0.032
-1.11%
jan 1, 2009
2.801
-0.019
-0.67%
jan 1, 2010
2.8
-0.001
-0.05%
jan 1, 2011
2.809
+0.009
0.32%
jan 1, 2012
2.819
+0.011
0.37%
jan 1, 2013
2.822
+0.003
0.09%
jan 1, 2014
2.813
-0.008
-0.3%
jan 1, 2015
2.791
-0.022
-0.8%
jan 1, 2016
2.76
-0.031
-1.12%
Ranking of countries by current statistics by years


Comments: