29
/
en
AIzaSyAYiBZKx7MnpbEhh9jyipgxe19OcubqV5w
April 1, 2024
198060
Moldova
MDA
true
2
1
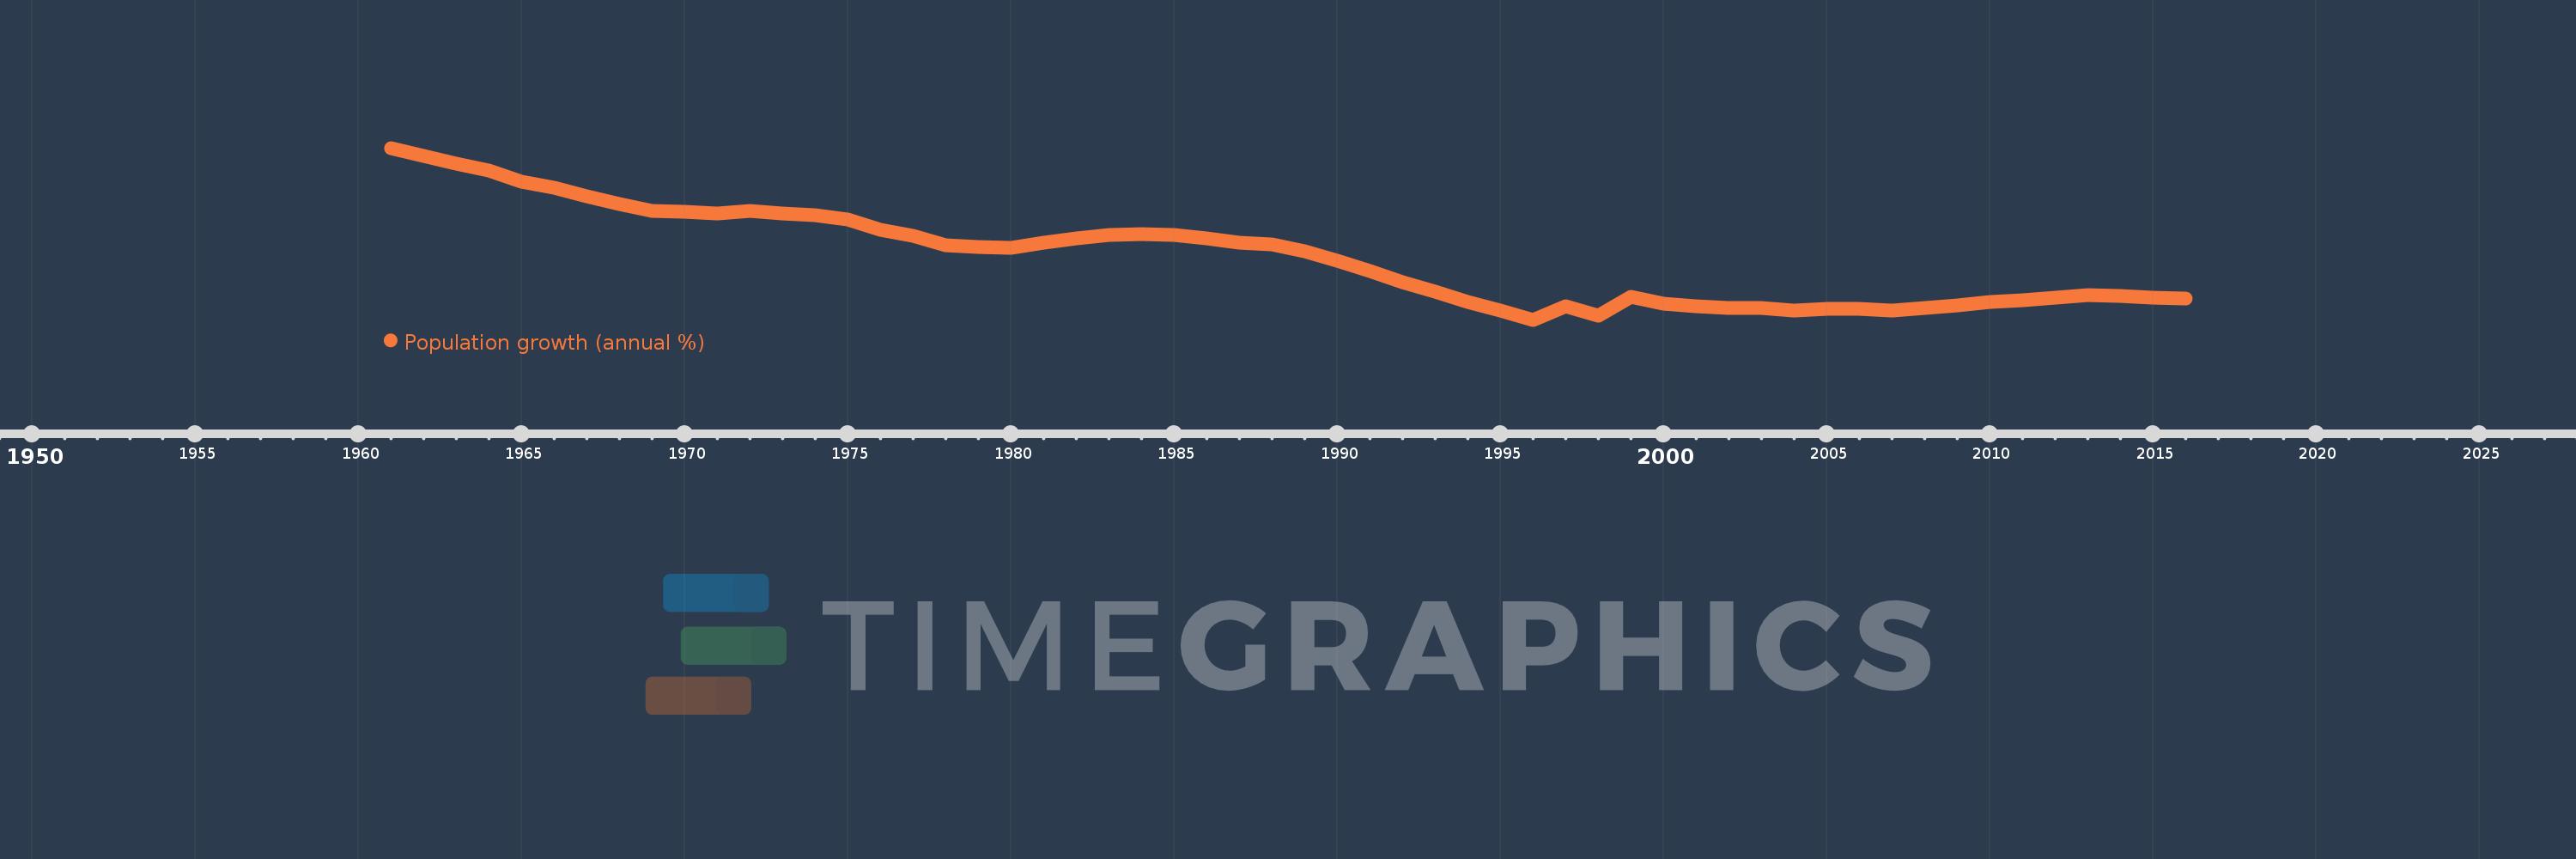
Population growth (annual %)
2016,2015,2014,2013,2012,2011,2010,2009,2008,2007,2006,2005,2004,2003,2002,2001,2000,1999,1998,1997,1996,1995,1994,1993,1992,1991,1990,1989,1988,1987,1986,1985,1984,1983,1982,1981,1980,1979,1978,1977,1976,1975,1974,1973,1972,1971,1970,1969,1968,1967,1966,1965,1964,1963,1962,1961
This statistics in other country:
AfghanistanAlbaniaAlgeriaAmerican SamoaAndorraAngolaAntigua and BarbudaArab WorldArgentinaArmeniaArubaAustraliaAustriaAzerbaijanBahamas, TheBahrainBangladeshBarbadosBelarusBelgiumBelizeBeninBermudaBhutanBoliviaBosnia and HerzegovinaBotswanaBrazilBritish Virgin IslandsBrunei DarussalamBulgariaBurkina FasoBurundiCabo VerdeCambodiaCameroonCanadaCaribbean small statesCayman IslandsCentral African RepublicCentral Europe and the BalticsChadChannel IslandsChileChinaColombiaComorosCongo, Dem. Rep.Congo, Rep.Costa RicaCote d'IvoireCroatiaCubaCuracaoCyprusCzech RepublicDenmarkDjiboutiDominicaDominican RepublicEarly-demographic dividendEast Asia & PacificEast Asia & Pacific (excluding high income)East Asia & Pacific (IDA & IBRD countries)EcuadorEgypt, Arab Rep.El SalvadorEquatorial GuineaEritreaEstoniaEthiopiaEuro areaEurope & Central AsiaEurope & Central Asia (excluding high income)Europe & Central Asia (IDA & IBRD countries)European UnionFaroe IslandsFijiFinlandFragile and conflict affected situationsFranceFrench PolynesiaGabonGambia, TheGeorgiaGermanyGhanaGibraltarGreeceGreenlandGrenadaGuamGuatemalaGuineaGuinea-BissauGuyanaHaitiHeavily indebted poor countries (HIPC)High incomeHondurasHong Kong SAR, ChinaHungaryIBRD onlyIcelandIDA & IBRD totalIDA blendIDA onlyIDA totalIndiaIndonesiaIran, Islamic Rep.IraqIrelandIsle of ManIsraelItalyJamaicaJapanJordanKazakhstanKenyaKiribatiKorea, Dem. People’s Rep.Korea, Rep.KosovoKuwaitKyrgyz RepublicLao PDRLate-demographic dividendLatin America & Caribbean Latin America & Caribbean (excluding high income)Latin America & the Caribbean (IDA & IBRD countries)LatviaLeast developed countries: UN classificationLebanonLesothoLiberiaLibyaLiechtensteinLithuaniaLow & middle incomeLow incomeLower middle incomeLuxembourgMacao SAR, ChinaMacedonia, FYRMadagascarMalawiMalaysiaMaldivesMaliMaltaMarshall IslandsMauritaniaMauritiusMexicoMicronesia, Fed. Sts.Middle East & North AfricaMiddle East & North Africa (excluding high income)Middle East & North Africa (IDA & IBRD countries)Middle incomeMoldovaMonacoMongoliaMontenegroMoroccoMozambiqueMyanmarNamibiaNauruNepalNetherlandsNew CaledoniaNew ZealandNicaraguaNigerNigeriaNorth AmericaNorthern Mariana IslandsNorwayOECD membersOmanOther small statesPacific island small statesPakistanPalauPanamaPapua New GuineaParaguayPeruPhilippinesPolandPortugalPost-demographic dividendPre-demographic dividendPuerto RicoQatarRomaniaRussian FederationRwandaSamoaSan MarinoSao Tome and PrincipeSaudi ArabiaSenegalSerbiaSeychellesSierra LeoneSingaporeSint Maarten (Dutch part)Slovak RepublicSloveniaSmall statesSolomon IslandsSomaliaSouth AfricaSouth AsiaSouth Asia (IDA & IBRD)South SudanSpainSri LankaSt. Kitts and NevisSt. LuciaSt. Martin (French part)St. Vincent and the GrenadinesSub-Saharan Africa Sub-Saharan Africa (excluding high income)Sub-Saharan Africa (IDA & IBRD countries)SudanSurinameSwazilandSwedenSwitzerlandSyrian Arab RepublicTajikistanTanzaniaThailandTimor-LesteTogoTongaTrinidad and TobagoTunisiaTurkeyTurkmenistanTurks and Caicos IslandsTuvaluUgandaUkraineUnited Arab EmiratesUnited KingdomUnited StatesUpper middle incomeUruguayUzbekistanVanuatuVenezuela, RBVietnamVirgin Islands (U.S.)West Bank and GazaWorldYemen, Rep.ZambiaZimbabwe Timeline:
This timeline shows a graph from 1961 to 2016 of Moldova. No data until 1960. Number of actual observations by date: 56.
Source name:
World Development Indicators
Source organization:
Derived from total population. Population source: (1) United Nations Population Division. World Population Prospects, (2) United Nations Statistical Division. Population and Vital Statistics Report (various years), (3) Census reports and other statistical
Categories, topics:
Climate Change, Health
Last updated:
apr 23, 2017
Indicators value changes by year
Minimum:
-0.432
jan 1, 1996
At the date of observation
Value
Absolute change
Change from previous value
jan 1, 1961
2.508
+2.508
0.0%
jan 1, 1962
2.37
-0.138
-5.51%
jan 1, 1963
2.24
-0.13
-5.48%
jan 1, 1964
2.117
-0.123
-5.47%
jan 1, 1965
1.929
-0.188
-8.88%
jan 1, 1966
1.822
-0.107
-5.56%
jan 1, 1967
1.685
-0.137
-7.52%
jan 1, 1968
1.554
-0.131
-7.76%
jan 1, 1969
1.429
-0.125
-8.05%
jan 1, 1970
1.409
-0.02
-1.41%
jan 1, 1971
1.389
-0.02
-1.39%
jan 1, 1972
1.435
+0.046
3.29%
jan 1, 1973
1.383
-0.052
-3.64%
jan 1, 1974
1.364
-0.019
-1.36%
jan 1, 1975
1.283
-0.081
-5.9%
jan 1, 1976
1.114
-0.17
-13.24%
jan 1, 1977
1.01
-0.104
-9.3%
jan 1, 1978
0.849
-0.161
-15.94%
jan 1, 1979
0.812
-0.037
-4.37%
jan 1, 1980
0.805
-0.007
-0.81%
jan 1, 1981
0.887
+0.082
10.17%
jan 1, 1982
0.967
+0.08
8.98%
jan 1, 1983
1.016
+0.048
5.01%
jan 1, 1984
1.034
+0.018
1.81%
jan 1, 1985
1.023
-0.011
-1.02%
jan 1, 1986
0.957
-0.066
-6.49%
jan 1, 1987
0.892
-0.065
-6.75%
jan 1, 1988
0.857
-0.035
-3.97%
jan 1, 1989
0.74
-0.117
-13.6%
jan 1, 1990
0.572
-0.168
-22.73%
jan 1, 1991
0.407
-0.165
-28.92%
jan 1, 1992
0.216
-0.19
-46.83%
jan 1, 1993
0.054
-0.162
-75.03%
jan 1, 1994
-0.135
-0.189
-350.1%
jan 1, 1995
-0.271
-0.136
100.41%
jan 1, 1996
-0.432
-0.161
59.57%
jan 1, 1997
-0.2
+0.232
-53.62%
jan 1, 1998
-0.37
-0.17
84.72%
jan 1, 1999
-0.04
+0.329
-89.08%
jan 1, 2000
-0.157
-0.117
288.66%
jan 1, 2001
-0.203
-0.046
29.51%
jan 1, 2002
-0.224
-0.02
9.97%
jan 1, 2003
-0.232
-0.008
3.56%
jan 1, 2004
-0.282
-0.05
21.6%
jan 1, 2005
-0.247
+0.034
-12.13%
jan 1, 2006
-0.243
+0.004
-1.67%
jan 1, 2007
-0.278
-0.035
14.23%
jan 1, 2008
-0.232
+0.046
-16.61%
jan 1, 2009
-0.19
+0.041
-17.87%
jan 1, 2010
-0.126
+0.064
-33.68%
jan 1, 2011
-0.1
+0.026
-20.89%
jan 1, 2012
-0.058
+0.042
-42.1%
jan 1, 2013
-0.013
+0.045
-77.31%
jan 1, 2014
-0.027
-0.014
104.11%
jan 1, 2015
-0.061
-0.034
127.7%
jan 1, 2016
-0.063
-0.002
3.66%
Ranking of countries by current statistics by years


Comments: