29
/
en
AIzaSyAYiBZKx7MnpbEhh9jyipgxe19OcubqV5w
April 1, 2024
29423
East Asia & Pacific (IDA & IBRD countries)
TEA
false
2
1
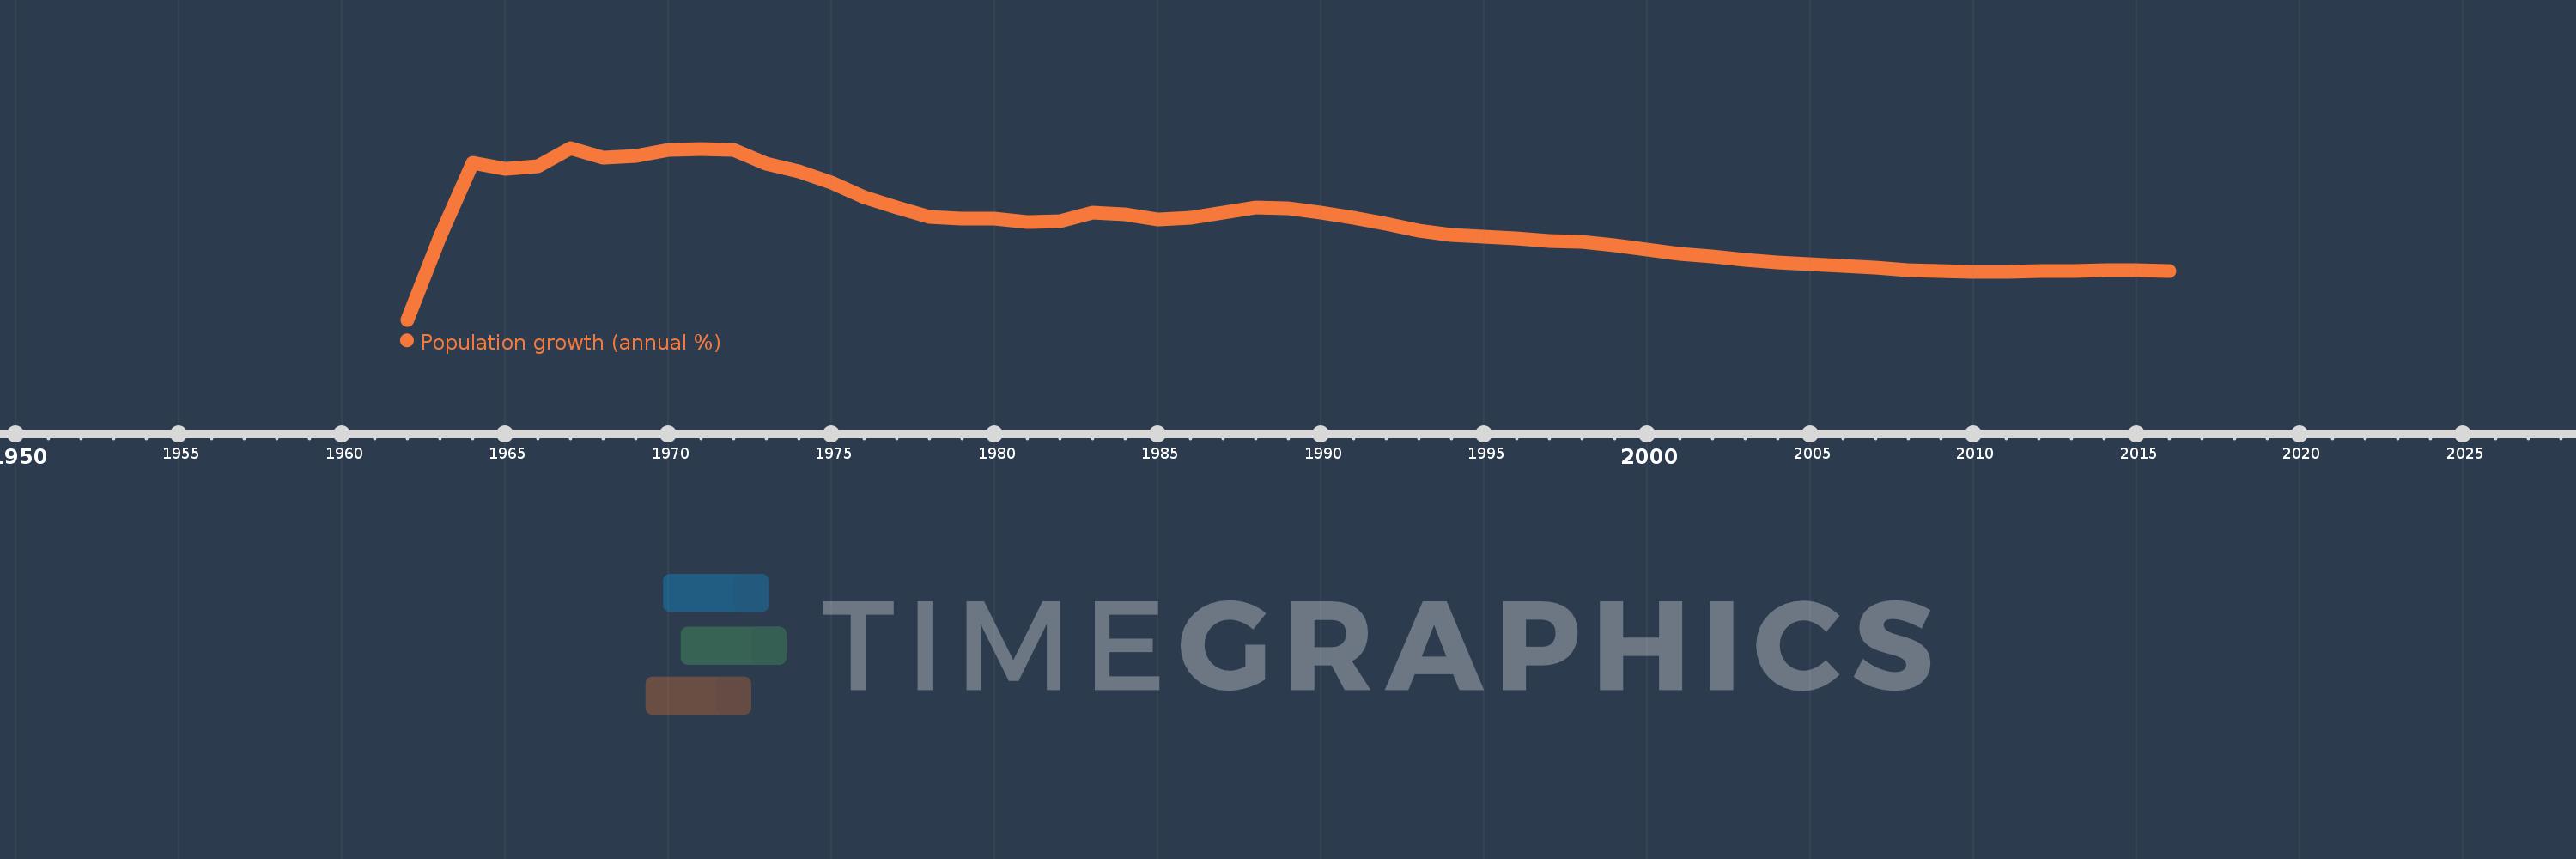
Population growth (annual %)
2016,2015,2014,2013,2012,2011,2010,2009,2008,2007,2006,2005,2004,2003,2002,2001,2000,1999,1998,1997,1996,1995,1994,1993,1992,1991,1990,1989,1988,1987,1986,1985,1984,1983,1982,1981,1980,1979,1978,1977,1976,1975,1974,1973,1972,1971,1970,1969,1968,1967,1966,1965,1964,1963,1962
This statistics in other country:
AfghanistanAlbaniaAlgeriaAmerican SamoaAndorraAngolaAntigua and BarbudaArab WorldArgentinaArmeniaArubaAustraliaAustriaAzerbaijanBahamas, TheBahrainBangladeshBarbadosBelarusBelgiumBelizeBeninBermudaBhutanBoliviaBosnia and HerzegovinaBotswanaBrazilBritish Virgin IslandsBrunei DarussalamBulgariaBurkina FasoBurundiCabo VerdeCambodiaCameroonCanadaCaribbean small statesCayman IslandsCentral African RepublicCentral Europe and the BalticsChadChannel IslandsChileChinaColombiaComorosCongo, Dem. Rep.Congo, Rep.Costa RicaCote d'IvoireCroatiaCubaCuracaoCyprusCzech RepublicDenmarkDjiboutiDominicaDominican RepublicEarly-demographic dividendEast Asia & PacificEast Asia & Pacific (excluding high income)East Asia & Pacific (IDA & IBRD countries)EcuadorEgypt, Arab Rep.El SalvadorEquatorial GuineaEritreaEstoniaEthiopiaEuro areaEurope & Central AsiaEurope & Central Asia (excluding high income)Europe & Central Asia (IDA & IBRD countries)European UnionFaroe IslandsFijiFinlandFragile and conflict affected situationsFranceFrench PolynesiaGabonGambia, TheGeorgiaGermanyGhanaGibraltarGreeceGreenlandGrenadaGuamGuatemalaGuineaGuinea-BissauGuyanaHaitiHeavily indebted poor countries (HIPC)High incomeHondurasHong Kong SAR, ChinaHungaryIBRD onlyIcelandIDA & IBRD totalIDA blendIDA onlyIDA totalIndiaIndonesiaIran, Islamic Rep.IraqIrelandIsle of ManIsraelItalyJamaicaJapanJordanKazakhstanKenyaKiribatiKorea, Dem. People’s Rep.Korea, Rep.KosovoKuwaitKyrgyz RepublicLao PDRLate-demographic dividendLatin America & Caribbean Latin America & Caribbean (excluding high income)Latin America & the Caribbean (IDA & IBRD countries)LatviaLeast developed countries: UN classificationLebanonLesothoLiberiaLibyaLiechtensteinLithuaniaLow & middle incomeLow incomeLower middle incomeLuxembourgMacao SAR, ChinaMacedonia, FYRMadagascarMalawiMalaysiaMaldivesMaliMaltaMarshall IslandsMauritaniaMauritiusMexicoMicronesia, Fed. Sts.Middle East & North AfricaMiddle East & North Africa (excluding high income)Middle East & North Africa (IDA & IBRD countries)Middle incomeMoldovaMonacoMongoliaMontenegroMoroccoMozambiqueMyanmarNamibiaNauruNepalNetherlandsNew CaledoniaNew ZealandNicaraguaNigerNigeriaNorth AmericaNorthern Mariana IslandsNorwayOECD membersOmanOther small statesPacific island small statesPakistanPalauPanamaPapua New GuineaParaguayPeruPhilippinesPolandPortugalPost-demographic dividendPre-demographic dividendPuerto RicoQatarRomaniaRussian FederationRwandaSamoaSan MarinoSao Tome and PrincipeSaudi ArabiaSenegalSerbiaSeychellesSierra LeoneSingaporeSint Maarten (Dutch part)Slovak RepublicSloveniaSmall statesSolomon IslandsSomaliaSouth AfricaSouth AsiaSouth Asia (IDA & IBRD)South SudanSpainSri LankaSt. Kitts and NevisSt. LuciaSt. Martin (French part)St. Vincent and the GrenadinesSub-Saharan Africa Sub-Saharan Africa (excluding high income)Sub-Saharan Africa (IDA & IBRD countries)SudanSurinameSwazilandSwedenSwitzerlandSyrian Arab RepublicTajikistanTanzaniaThailandTimor-LesteTogoTongaTrinidad and TobagoTunisiaTurkeyTurkmenistanTurks and Caicos IslandsTuvaluUgandaUkraineUnited Arab EmiratesUnited KingdomUnited StatesUpper middle incomeUruguayUzbekistanVanuatuVenezuela, RBVietnamVirgin Islands (U.S.)West Bank and GazaWorldYemen, Rep.ZambiaZimbabwe Timeline:
This timeline shows a graph from 1962 to 2016 of East Asia & Pacific (IDA & IBRD countries). No data until 1961. Number of actual observations by date: 55.
Source name:
World Development Indicators
Source organization:
Derived from total population. Population source: (1) United Nations Population Division. World Population Prospects, (2) United Nations Statistical Division. Population and Vital Statistics Report (various years), (3) Census reports and other statistical
Categories, topics:
Climate Change, Health
Last updated:
apr 23, 2017
Indicators value changes by year
Minimum:
-0.107
jan 1, 1962
At the date of observation
Value
Absolute change
Change from previous value
jan 1, 1962
-0.107
-0.107
0.0%
jan 1, 1963
1.29
+1.397
-1.3K%
jan 1, 1964
2.535
+1.245
96.54%
jan 1, 1965
2.432
-0.103
-4.08%
jan 1, 1966
2.478
+0.046
1.9%
jan 1, 1967
2.786
+0.308
12.42%
jan 1, 1968
2.619
-0.167
-6.0%
jan 1, 1969
2.648
+0.029
1.11%
jan 1, 1970
2.746
+0.098
3.71%
jan 1, 1971
2.762
+0.016
0.59%
jan 1, 1972
2.751
-0.011
-0.39%
jan 1, 1973
2.528
-0.223
-8.1%
jan 1, 1974
2.388
-0.14
-5.54%
jan 1, 1975
2.208
-0.18
-7.53%
jan 1, 1976
1.963
-0.245
-11.11%
jan 1, 1977
1.777
-0.186
-9.46%
jan 1, 1978
1.621
-0.156
-8.78%
jan 1, 1979
1.593
-0.028
-1.75%
jan 1, 1980
1.589
-0.004
-0.23%
jan 1, 1981
1.535
-0.054
-3.39%
jan 1, 1982
1.555
+0.02
1.3%
jan 1, 1983
1.697
+0.142
9.12%
jan 1, 1984
1.675
-0.022
-1.27%
jan 1, 1985
1.574
-0.101
-6.04%
jan 1, 1986
1.607
+0.033
2.1%
jan 1, 1987
1.699
+0.092
5.73%
jan 1, 1988
1.778
+0.079
4.65%
jan 1, 1989
1.767
-0.011
-0.64%
jan 1, 1990
1.692
-0.075
-4.27%
jan 1, 1991
1.606
-0.085
-5.04%
jan 1, 1992
1.51
-0.096
-5.99%
jan 1, 1993
1.39
-0.121
-7.99%
jan 1, 1994
1.319
-0.07
-5.05%
jan 1, 1995
1.296
-0.024
-1.8%
jan 1, 1996
1.258
-0.037
-2.87%
jan 1, 1997
1.226
-0.032
-2.58%
jan 1, 1998
1.202
-0.024
-1.93%
jan 1, 1999
1.15
-0.052
-4.32%
jan 1, 2000
1.075
-0.075
-6.52%
jan 1, 2001
1.005
-0.07
-6.51%
jan 1, 2002
0.952
-0.053
-5.32%
jan 1, 2003
0.901
-0.051
-5.34%
jan 1, 2004
0.859
-0.042
-4.69%
jan 1, 2005
0.827
-0.032
-3.68%
jan 1, 2006
0.807
-0.021
-2.51%
jan 1, 2007
0.767
-0.039
-4.89%
jan 1, 2008
0.727
-0.04
-5.25%
jan 1, 2009
0.711
-0.015
-2.11%
jan 1, 2010
0.702
-0.01
-1.39%
jan 1, 2011
0.698
-0.004
-0.58%
jan 1, 2012
0.706
+0.008
1.17%
jan 1, 2013
0.717
+0.011
1.53%
jan 1, 2014
0.722
+0.006
0.81%
jan 1, 2015
0.727
+0.005
0.64%
jan 1, 2016
0.719
-0.008
-1.11%
Ranking of countries by current statistics by years


Comments: