29
/
en
AIzaSyAYiBZKx7MnpbEhh9jyipgxe19OcubqV5w
April 1, 2024
202076
Morocco
MAR
true
2
1
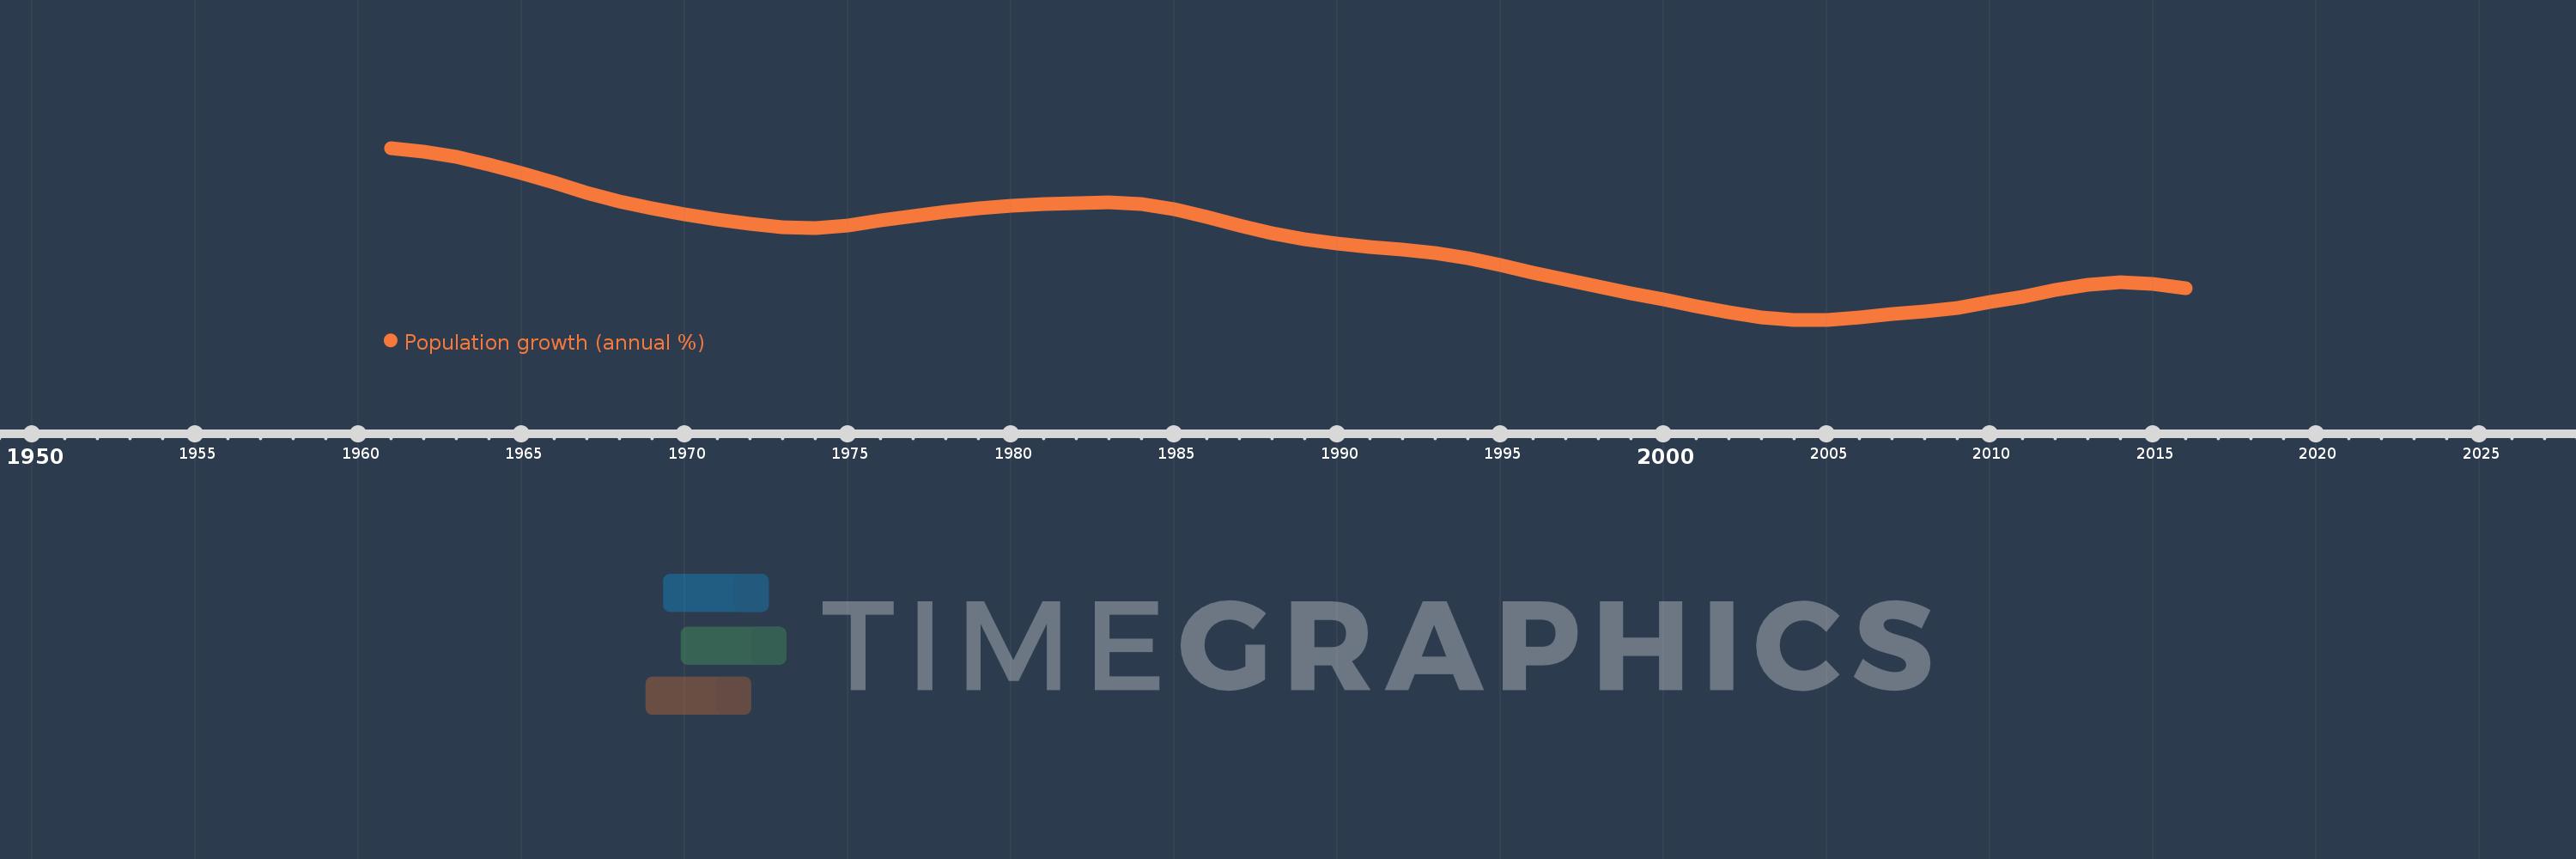
Population growth (annual %)
2016,2015,2014,2013,2012,2011,2010,2009,2008,2007,2006,2005,2004,2003,2002,2001,2000,1999,1998,1997,1996,1995,1994,1993,1992,1991,1990,1989,1988,1987,1986,1985,1984,1983,1982,1981,1980,1979,1978,1977,1976,1975,1974,1973,1972,1971,1970,1969,1968,1967,1966,1965,1964,1963,1962,1961
This statistics in other country:
AfghanistanAlbaniaAlgeriaAmerican SamoaAndorraAngolaAntigua and BarbudaArab WorldArgentinaArmeniaArubaAustraliaAustriaAzerbaijanBahamas, TheBahrainBangladeshBarbadosBelarusBelgiumBelizeBeninBermudaBhutanBoliviaBosnia and HerzegovinaBotswanaBrazilBritish Virgin IslandsBrunei DarussalamBulgariaBurkina FasoBurundiCabo VerdeCambodiaCameroonCanadaCaribbean small statesCayman IslandsCentral African RepublicCentral Europe and the BalticsChadChannel IslandsChileChinaColombiaComorosCongo, Dem. Rep.Congo, Rep.Costa RicaCote d'IvoireCroatiaCubaCuracaoCyprusCzech RepublicDenmarkDjiboutiDominicaDominican RepublicEarly-demographic dividendEast Asia & PacificEast Asia & Pacific (excluding high income)East Asia & Pacific (IDA & IBRD countries)EcuadorEgypt, Arab Rep.El SalvadorEquatorial GuineaEritreaEstoniaEthiopiaEuro areaEurope & Central AsiaEurope & Central Asia (excluding high income)Europe & Central Asia (IDA & IBRD countries)European UnionFaroe IslandsFijiFinlandFragile and conflict affected situationsFranceFrench PolynesiaGabonGambia, TheGeorgiaGermanyGhanaGibraltarGreeceGreenlandGrenadaGuamGuatemalaGuineaGuinea-BissauGuyanaHaitiHeavily indebted poor countries (HIPC)High incomeHondurasHong Kong SAR, ChinaHungaryIBRD onlyIcelandIDA & IBRD totalIDA blendIDA onlyIDA totalIndiaIndonesiaIran, Islamic Rep.IraqIrelandIsle of ManIsraelItalyJamaicaJapanJordanKazakhstanKenyaKiribatiKorea, Dem. People’s Rep.Korea, Rep.KosovoKuwaitKyrgyz RepublicLao PDRLate-demographic dividendLatin America & Caribbean Latin America & Caribbean (excluding high income)Latin America & the Caribbean (IDA & IBRD countries)LatviaLeast developed countries: UN classificationLebanonLesothoLiberiaLibyaLiechtensteinLithuaniaLow & middle incomeLow incomeLower middle incomeLuxembourgMacao SAR, ChinaMacedonia, FYRMadagascarMalawiMalaysiaMaldivesMaliMaltaMarshall IslandsMauritaniaMauritiusMexicoMicronesia, Fed. Sts.Middle East & North AfricaMiddle East & North Africa (excluding high income)Middle East & North Africa (IDA & IBRD countries)Middle incomeMoldovaMonacoMongoliaMontenegroMoroccoMozambiqueMyanmarNamibiaNauruNepalNetherlandsNew CaledoniaNew ZealandNicaraguaNigerNigeriaNorth AmericaNorthern Mariana IslandsNorwayOECD membersOmanOther small statesPacific island small statesPakistanPalauPanamaPapua New GuineaParaguayPeruPhilippinesPolandPortugalPost-demographic dividendPre-demographic dividendPuerto RicoQatarRomaniaRussian FederationRwandaSamoaSan MarinoSao Tome and PrincipeSaudi ArabiaSenegalSerbiaSeychellesSierra LeoneSingaporeSint Maarten (Dutch part)Slovak RepublicSloveniaSmall statesSolomon IslandsSomaliaSouth AfricaSouth AsiaSouth Asia (IDA & IBRD)South SudanSpainSri LankaSt. Kitts and NevisSt. LuciaSt. Martin (French part)St. Vincent and the GrenadinesSub-Saharan Africa Sub-Saharan Africa (excluding high income)Sub-Saharan Africa (IDA & IBRD countries)SudanSurinameSwazilandSwedenSwitzerlandSyrian Arab RepublicTajikistanTanzaniaThailandTimor-LesteTogoTongaTrinidad and TobagoTunisiaTurkeyTurkmenistanTurks and Caicos IslandsTuvaluUgandaUkraineUnited Arab EmiratesUnited KingdomUnited StatesUpper middle incomeUruguayUzbekistanVanuatuVenezuela, RBVietnamVirgin Islands (U.S.)West Bank and GazaWorldYemen, Rep.ZambiaZimbabwe Timeline:
This timeline shows a graph from 1961 to 2016 of Morocco. No data until 1960. Number of actual observations by date: 56.
Source name:
World Development Indicators
Source organization:
Derived from total population. Population source: (1) United Nations Population Division. World Population Prospects, (2) United Nations Statistical Division. Population and Vital Statistics Report (various years), (3) Census reports and other statistical
Categories, topics:
Climate Change, Health
Last updated:
apr 23, 2017
Indicators value changes by year
At the date of observation
Value
Absolute change
Change from previous value
jan 1, 1961
3.123
+3.123
0.0%
jan 1, 1962
3.071
-0.052
-1.67%
jan 1, 1963
3.005
-0.066
-2.16%
jan 1, 1964
2.916
-0.089
-2.95%
jan 1, 1965
2.803
-0.113
-3.87%
jan 1, 1966
2.677
-0.126
-4.49%
jan 1, 1967
2.554
-0.123
-4.6%
jan 1, 1968
2.445
-0.109
-4.27%
jan 1, 1969
2.351
-0.095
-3.87%
jan 1, 1970
2.275
-0.076
-3.23%
jan 1, 1971
2.216
-0.058
-2.56%
jan 1, 1972
2.161
-0.056
-2.51%
jan 1, 1973
2.116
-0.044
-2.05%
jan 1, 1974
2.107
-0.009
-0.44%
jan 1, 1975
2.139
+0.032
1.5%
jan 1, 1976
2.197
+0.058
2.73%
jan 1, 1977
2.258
+0.061
2.77%
jan 1, 1978
2.308
+0.05
2.22%
jan 1, 1979
2.352
+0.043
1.88%
jan 1, 1980
2.384
+0.033
1.38%
jan 1, 1981
2.404
+0.02
0.84%
jan 1, 1982
2.424
+0.02
0.82%
jan 1, 1983
2.432
+0.008
0.34%
jan 1, 1984
2.406
-0.026
-1.08%
jan 1, 1985
2.339
-0.067
-2.79%
jan 1, 1986
2.245
-0.094
-4.02%
jan 1, 1987
2.139
-0.106
-4.71%
jan 1, 1988
2.041
-0.098
-4.57%
jan 1, 1989
1.961
-0.081
-3.96%
jan 1, 1990
1.905
-0.056
-2.86%
jan 1, 1991
1.864
-0.041
-2.13%
jan 1, 1992
1.827
-0.037
-1.98%
jan 1, 1993
1.78
-0.047
-2.59%
jan 1, 1994
1.717
-0.063
-3.54%
jan 1, 1995
1.633
-0.083
-4.86%
jan 1, 1996
1.537
-0.097
-5.91%
jan 1, 1997
1.444
-0.093
-6.05%
jan 1, 1998
1.359
-0.085
-5.86%
jan 1, 1999
1.274
-0.085
-6.24%
jan 1, 2000
1.19
-0.085
-6.63%
jan 1, 2001
1.11
-0.08
-6.72%
jan 1, 2002
1.032
-0.078
-6.99%
jan 1, 2003
0.968
-0.064
-6.21%
jan 1, 2004
0.934
-0.034
-3.56%
jan 1, 2005
0.936
+0.002
0.26%
jan 1, 2006
0.967
+0.031
3.27%
jan 1, 2007
1.002
+0.035
3.62%
jan 1, 2008
1.037
+0.035
3.49%
jan 1, 2009
1.088
+0.051
4.92%
jan 1, 2010
1.156
+0.068
6.23%
jan 1, 2011
1.231
+0.075
6.51%
jan 1, 2012
1.313
+0.082
6.64%
jan 1, 2013
1.381
+0.068
5.17%
jan 1, 2014
1.41
+0.03
2.16%
jan 1, 2015
1.391
-0.02
-1.39%
jan 1, 2016
1.336
-0.055
-3.92%
Ranking of countries by current statistics by years


Comments: