29
/
en
AIzaSyAYiBZKx7MnpbEhh9jyipgxe19OcubqV5w
April 1, 2024
214698
Norway
NOR
true
2
1
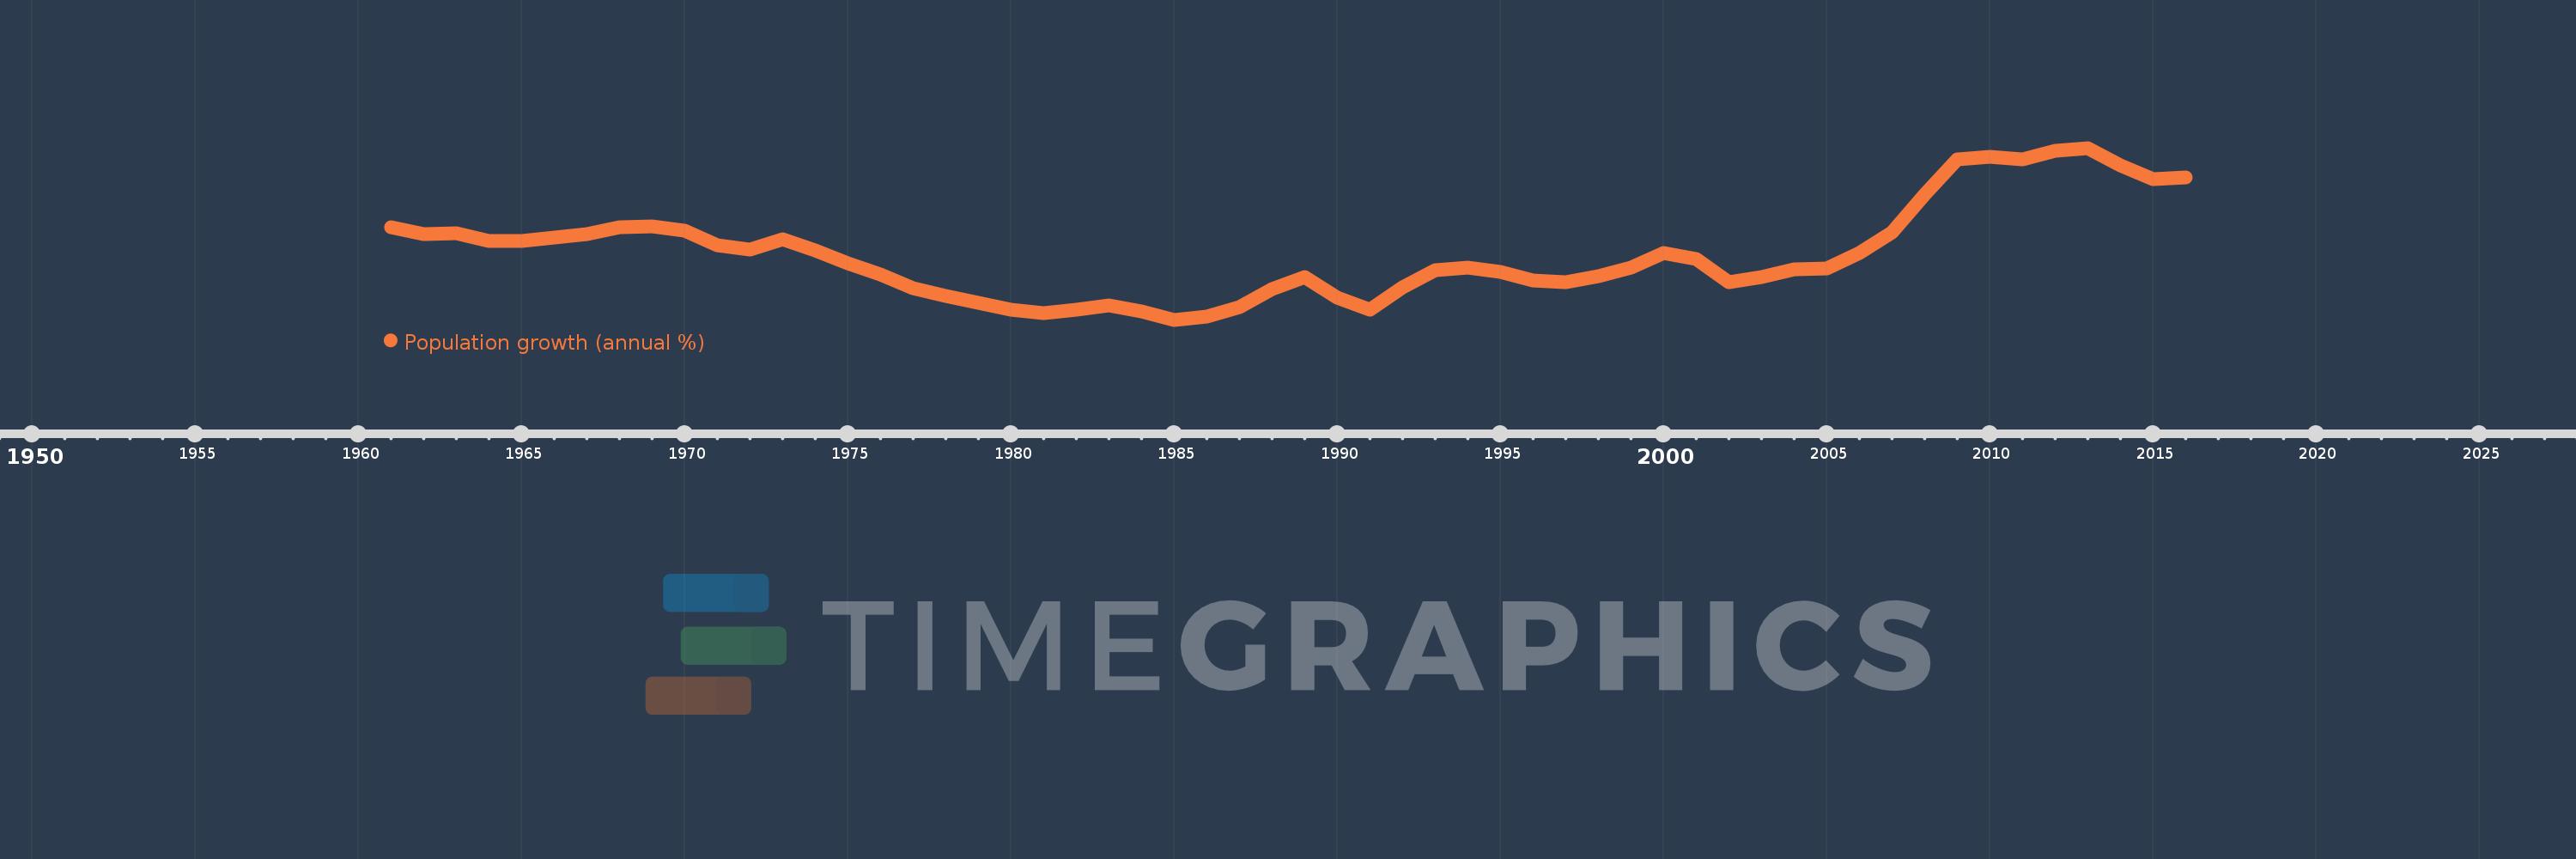
Population growth (annual %)
2016,2015,2014,2013,2012,2011,2010,2009,2008,2007,2006,2005,2004,2003,2002,2001,2000,1999,1998,1997,1996,1995,1994,1993,1992,1991,1990,1989,1988,1987,1986,1985,1984,1983,1982,1981,1980,1979,1978,1977,1976,1975,1974,1973,1972,1971,1970,1969,1968,1967,1966,1965,1964,1963,1962,1961
This statistics in other country:
AfghanistanAlbaniaAlgeriaAmerican SamoaAndorraAngolaAntigua and BarbudaArab WorldArgentinaArmeniaArubaAustraliaAustriaAzerbaijanBahamas, TheBahrainBangladeshBarbadosBelarusBelgiumBelizeBeninBermudaBhutanBoliviaBosnia and HerzegovinaBotswanaBrazilBritish Virgin IslandsBrunei DarussalamBulgariaBurkina FasoBurundiCabo VerdeCambodiaCameroonCanadaCaribbean small statesCayman IslandsCentral African RepublicCentral Europe and the BalticsChadChannel IslandsChileChinaColombiaComorosCongo, Dem. Rep.Congo, Rep.Costa RicaCote d'IvoireCroatiaCubaCuracaoCyprusCzech RepublicDenmarkDjiboutiDominicaDominican RepublicEarly-demographic dividendEast Asia & PacificEast Asia & Pacific (excluding high income)East Asia & Pacific (IDA & IBRD countries)EcuadorEgypt, Arab Rep.El SalvadorEquatorial GuineaEritreaEstoniaEthiopiaEuro areaEurope & Central AsiaEurope & Central Asia (excluding high income)Europe & Central Asia (IDA & IBRD countries)European UnionFaroe IslandsFijiFinlandFragile and conflict affected situationsFranceFrench PolynesiaGabonGambia, TheGeorgiaGermanyGhanaGibraltarGreeceGreenlandGrenadaGuamGuatemalaGuineaGuinea-BissauGuyanaHaitiHeavily indebted poor countries (HIPC)High incomeHondurasHong Kong SAR, ChinaHungaryIBRD onlyIcelandIDA & IBRD totalIDA blendIDA onlyIDA totalIndiaIndonesiaIran, Islamic Rep.IraqIrelandIsle of ManIsraelItalyJamaicaJapanJordanKazakhstanKenyaKiribatiKorea, Dem. People’s Rep.Korea, Rep.KosovoKuwaitKyrgyz RepublicLao PDRLate-demographic dividendLatin America & Caribbean Latin America & Caribbean (excluding high income)Latin America & the Caribbean (IDA & IBRD countries)LatviaLeast developed countries: UN classificationLebanonLesothoLiberiaLibyaLiechtensteinLithuaniaLow & middle incomeLow incomeLower middle incomeLuxembourgMacao SAR, ChinaMacedonia, FYRMadagascarMalawiMalaysiaMaldivesMaliMaltaMarshall IslandsMauritaniaMauritiusMexicoMicronesia, Fed. Sts.Middle East & North AfricaMiddle East & North Africa (excluding high income)Middle East & North Africa (IDA & IBRD countries)Middle incomeMoldovaMonacoMongoliaMontenegroMoroccoMozambiqueMyanmarNamibiaNauruNepalNetherlandsNew CaledoniaNew ZealandNicaraguaNigerNigeriaNorth AmericaNorthern Mariana IslandsNorwayOECD membersOmanOther small statesPacific island small statesPakistanPalauPanamaPapua New GuineaParaguayPeruPhilippinesPolandPortugalPost-demographic dividendPre-demographic dividendPuerto RicoQatarRomaniaRussian FederationRwandaSamoaSan MarinoSao Tome and PrincipeSaudi ArabiaSenegalSerbiaSeychellesSierra LeoneSingaporeSint Maarten (Dutch part)Slovak RepublicSloveniaSmall statesSolomon IslandsSomaliaSouth AfricaSouth AsiaSouth Asia (IDA & IBRD)South SudanSpainSri LankaSt. Kitts and NevisSt. LuciaSt. Martin (French part)St. Vincent and the GrenadinesSub-Saharan Africa Sub-Saharan Africa (excluding high income)Sub-Saharan Africa (IDA & IBRD countries)SudanSurinameSwazilandSwedenSwitzerlandSyrian Arab RepublicTajikistanTanzaniaThailandTimor-LesteTogoTongaTrinidad and TobagoTunisiaTurkeyTurkmenistanTurks and Caicos IslandsTuvaluUgandaUkraineUnited Arab EmiratesUnited KingdomUnited StatesUpper middle incomeUruguayUzbekistanVanuatuVenezuela, RBVietnamVirgin Islands (U.S.)West Bank and GazaWorldYemen, Rep.ZambiaZimbabwe Timeline:
This timeline shows a graph from 1961 to 2016 of Norway. No data until 1960. Number of actual observations by date: 56.
Source name:
World Development Indicators
Source organization:
Derived from total population. Population source: (1) United Nations Population Division. World Population Prospects, (2) United Nations Statistical Division. Population and Vital Statistics Report (various years), (3) Census reports and other statistical
Categories, topics:
Climate Change, Health
Last updated:
apr 23, 2017
Indicators value changes by year
At the date of observation
Value
Absolute change
Change from previous value
jan 1, 1961
0.839
+0.839
0.0%
jan 1, 1962
0.794
-0.045
-5.36%
jan 1, 1963
0.803
+0.009
1.14%
jan 1, 1964
0.756
-0.047
-5.88%
jan 1, 1965
0.755
-0.001
-0.1%
jan 1, 1966
0.777
+0.022
2.9%
jan 1, 1967
0.798
+0.021
2.71%
jan 1, 1968
0.837
+0.038
4.78%
jan 1, 1969
0.841
+0.004
0.49%
jan 1, 1970
0.815
-0.026
-3.08%
jan 1, 1971
0.727
-0.088
-10.83%
jan 1, 1972
0.701
-0.025
-3.47%
jan 1, 1973
0.765
+0.064
9.06%
jan 1, 1974
0.7
-0.065
-8.54%
jan 1, 1975
0.62
-0.079
-11.32%
jan 1, 1976
0.552
-0.068
-11.04%
jan 1, 1977
0.469
-0.083
-15.02%
jan 1, 1978
0.423
-0.046
-9.88%
jan 1, 1979
0.382
-0.041
-9.67%
jan 1, 1980
0.341
-0.041
-10.8%
jan 1, 1981
0.321
-0.019
-5.68%
jan 1, 1982
0.344
+0.023
7.11%
jan 1, 1983
0.367
+0.023
6.74%
jan 1, 1984
0.331
-0.036
-9.86%
jan 1, 1985
0.282
-0.049
-14.76%
jan 1, 1986
0.299
+0.017
6.12%
jan 1, 1987
0.357
+0.057
19.11%
jan 1, 1988
0.468
+0.111
31.22%
jan 1, 1989
0.538
+0.07
14.93%
jan 1, 1990
0.413
-0.125
-23.26%
jan 1, 1991
0.344
-0.069
-16.63%
jan 1, 1992
0.477
+0.132
38.46%
jan 1, 1993
0.577
+0.101
21.13%
jan 1, 1994
0.595
+0.018
3.13%
jan 1, 1995
0.569
-0.026
-4.34%
jan 1, 1996
0.519
-0.05
-8.83%
jan 1, 1997
0.507
-0.012
-2.36%
jan 1, 1998
0.542
+0.035
6.97%
jan 1, 1999
0.595
+0.053
9.81%
jan 1, 2000
0.685
+0.089
15.01%
jan 1, 2001
0.649
-0.036
-5.22%
jan 1, 2002
0.506
-0.143
-22.03%
jan 1, 2003
0.539
+0.033
6.57%
jan 1, 2004
0.587
+0.047
8.76%
jan 1, 2005
0.591
+0.004
0.75%
jan 1, 2006
0.681
+0.09
15.25%
jan 1, 2007
0.805
+0.124
18.25%
jan 1, 2008
1.035
+0.229
28.48%
jan 1, 2009
1.246
+0.212
20.45%
jan 1, 2010
1.261
+0.015
1.19%
jan 1, 2011
1.246
-0.015
-1.23%
jan 1, 2012
1.297
+0.052
4.14%
jan 1, 2013
1.313
+0.016
1.25%
jan 1, 2014
1.209
-0.104
-7.94%
jan 1, 2015
1.128
-0.081
-6.73%
jan 1, 2016
1.136
+0.008
0.73%
Ranking of countries by current statistics by years


Comments: