29
/
en
AIzaSyAYiBZKx7MnpbEhh9jyipgxe19OcubqV5w
April 1, 2024
66498
Algeria
DZA
true
2
1
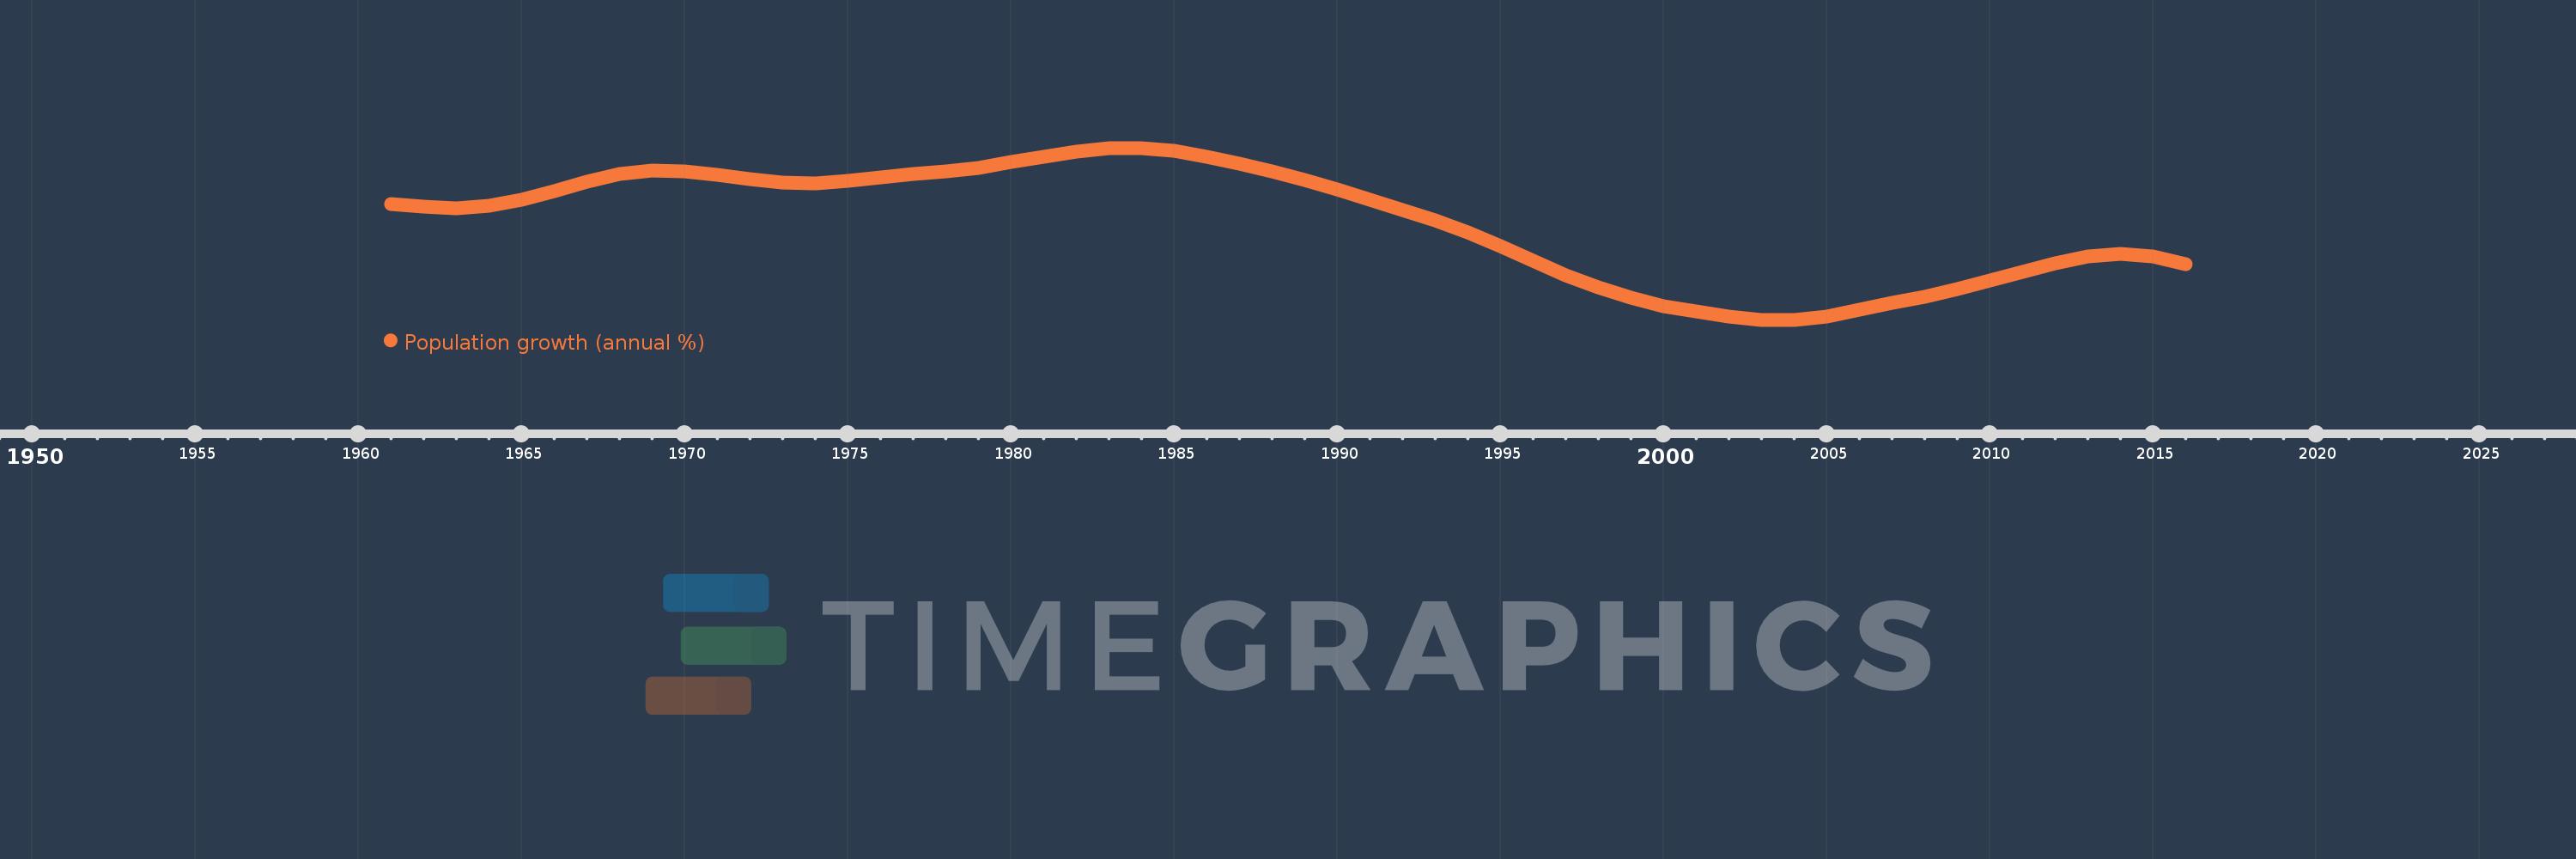
Population growth (annual %)
2016,2015,2014,2013,2012,2011,2010,2009,2008,2007,2006,2005,2004,2003,2002,2001,2000,1999,1998,1997,1996,1995,1994,1993,1992,1991,1990,1989,1988,1987,1986,1985,1984,1983,1982,1981,1980,1979,1978,1977,1976,1975,1974,1973,1972,1971,1970,1969,1968,1967,1966,1965,1964,1963,1962,1961
This statistics in other country:
AfghanistanAlbaniaAlgeriaAmerican SamoaAndorraAngolaAntigua and BarbudaArab WorldArgentinaArmeniaArubaAustraliaAustriaAzerbaijanBahamas, TheBahrainBangladeshBarbadosBelarusBelgiumBelizeBeninBermudaBhutanBoliviaBosnia and HerzegovinaBotswanaBrazilBritish Virgin IslandsBrunei DarussalamBulgariaBurkina FasoBurundiCabo VerdeCambodiaCameroonCanadaCaribbean small statesCayman IslandsCentral African RepublicCentral Europe and the BalticsChadChannel IslandsChileChinaColombiaComorosCongo, Dem. Rep.Congo, Rep.Costa RicaCote d'IvoireCroatiaCubaCuracaoCyprusCzech RepublicDenmarkDjiboutiDominicaDominican RepublicEarly-demographic dividendEast Asia & PacificEast Asia & Pacific (excluding high income)East Asia & Pacific (IDA & IBRD countries)EcuadorEgypt, Arab Rep.El SalvadorEquatorial GuineaEritreaEstoniaEthiopiaEuro areaEurope & Central AsiaEurope & Central Asia (excluding high income)Europe & Central Asia (IDA & IBRD countries)European UnionFaroe IslandsFijiFinlandFragile and conflict affected situationsFranceFrench PolynesiaGabonGambia, TheGeorgiaGermanyGhanaGibraltarGreeceGreenlandGrenadaGuamGuatemalaGuineaGuinea-BissauGuyanaHaitiHeavily indebted poor countries (HIPC)High incomeHondurasHong Kong SAR, ChinaHungaryIBRD onlyIcelandIDA & IBRD totalIDA blendIDA onlyIDA totalIndiaIndonesiaIran, Islamic Rep.IraqIrelandIsle of ManIsraelItalyJamaicaJapanJordanKazakhstanKenyaKiribatiKorea, Dem. People’s Rep.Korea, Rep.KosovoKuwaitKyrgyz RepublicLao PDRLate-demographic dividendLatin America & Caribbean Latin America & Caribbean (excluding high income)Latin America & the Caribbean (IDA & IBRD countries)LatviaLeast developed countries: UN classificationLebanonLesothoLiberiaLibyaLiechtensteinLithuaniaLow & middle incomeLow incomeLower middle incomeLuxembourgMacao SAR, ChinaMacedonia, FYRMadagascarMalawiMalaysiaMaldivesMaliMaltaMarshall IslandsMauritaniaMauritiusMexicoMicronesia, Fed. Sts.Middle East & North AfricaMiddle East & North Africa (excluding high income)Middle East & North Africa (IDA & IBRD countries)Middle incomeMoldovaMonacoMongoliaMontenegroMoroccoMozambiqueMyanmarNamibiaNauruNepalNetherlandsNew CaledoniaNew ZealandNicaraguaNigerNigeriaNorth AmericaNorthern Mariana IslandsNorwayOECD membersOmanOther small statesPacific island small statesPakistanPalauPanamaPapua New GuineaParaguayPeruPhilippinesPolandPortugalPost-demographic dividendPre-demographic dividendPuerto RicoQatarRomaniaRussian FederationRwandaSamoaSan MarinoSao Tome and PrincipeSaudi ArabiaSenegalSerbiaSeychellesSierra LeoneSingaporeSint Maarten (Dutch part)Slovak RepublicSloveniaSmall statesSolomon IslandsSomaliaSouth AfricaSouth AsiaSouth Asia (IDA & IBRD)South SudanSpainSri LankaSt. Kitts and NevisSt. LuciaSt. Martin (French part)St. Vincent and the GrenadinesSub-Saharan Africa Sub-Saharan Africa (excluding high income)Sub-Saharan Africa (IDA & IBRD countries)SudanSurinameSwazilandSwedenSwitzerlandSyrian Arab RepublicTajikistanTanzaniaThailandTimor-LesteTogoTongaTrinidad and TobagoTunisiaTurkeyTurkmenistanTurks and Caicos IslandsTuvaluUgandaUkraineUnited Arab EmiratesUnited KingdomUnited StatesUpper middle incomeUruguayUzbekistanVanuatuVenezuela, RBVietnamVirgin Islands (U.S.)West Bank and GazaWorldYemen, Rep.ZambiaZimbabwe Timeline:
This timeline shows a graph from 1961 to 2016 of Algeria. No data until 1960. Number of actual observations by date: 56.
Source name:
World Development Indicators
Source organization:
Derived from total population. Population source: (1) United Nations Population Division. World Population Prospects, (2) United Nations Statistical Division. Population and Vital Statistics Report (various years), (3) Census reports and other statistical
Categories, topics:
Climate Change, Health
Last updated:
apr 23, 2017
Indicators value changes by year
At the date of observation
Value
Absolute change
Change from previous value
jan 1, 1961
2.511
+2.511
0.0%
jan 1, 1962
2.485
-0.026
-1.04%
jan 1, 1963
2.471
-0.015
-0.59%
jan 1, 1964
2.492
+0.021
0.86%
jan 1, 1965
2.561
+0.069
2.75%
jan 1, 1966
2.656
+0.096
3.74%
jan 1, 1967
2.76
+0.103
3.9%
jan 1, 1968
2.84
+0.08
2.91%
jan 1, 1969
2.88
+0.04
1.41%
jan 1, 1970
2.869
-0.011
-0.38%
jan 1, 1971
2.827
-0.042
-1.46%
jan 1, 1972
2.779
-0.048
-1.69%
jan 1, 1973
2.749
-0.03
-1.09%
jan 1, 1974
2.741
-0.008
-0.29%
jan 1, 1975
2.763
+0.021
0.78%
jan 1, 1976
2.804
+0.041
1.5%
jan 1, 1977
2.839
+0.035
1.25%
jan 1, 1978
2.867
+0.028
0.99%
jan 1, 1979
2.909
+0.042
1.47%
jan 1, 1980
2.967
+0.058
1.99%
jan 1, 1981
3.029
+0.062
2.1%
jan 1, 1982
3.085
+0.056
1.86%
jan 1, 1983
3.12
+0.035
1.12%
jan 1, 1984
3.122
+0.002
0.08%
jan 1, 1985
3.087
-0.035
-1.13%
jan 1, 1986
3.023
-0.064
-2.06%
jan 1, 1987
2.949
-0.074
-2.46%
jan 1, 1988
2.87
-0.079
-2.69%
jan 1, 1989
2.777
-0.092
-3.22%
jan 1, 1990
2.673
-0.104
-3.76%
jan 1, 1991
2.559
-0.114
-4.26%
jan 1, 1992
2.447
-0.112
-4.38%
jan 1, 1993
2.332
-0.115
-4.68%
jan 1, 1994
2.202
-0.131
-5.61%
jan 1, 1995
2.052
-0.15
-6.8%
jan 1, 1996
1.894
-0.158
-7.7%
jan 1, 1997
1.741
-0.153
-8.09%
jan 1, 1998
1.605
-0.136
-7.79%
jan 1, 1999
1.492
-0.113
-7.06%
jan 1, 2000
1.406
-0.085
-5.72%
jan 1, 2001
1.347
-0.06
-4.25%
jan 1, 2002
1.296
-0.051
-3.78%
jan 1, 2003
1.258
-0.037
-2.87%
jan 1, 2004
1.257
-0.002
-0.16%
jan 1, 2005
1.295
+0.039
3.09%
jan 1, 2006
1.364
+0.069
5.3%
jan 1, 2007
1.437
+0.073
5.34%
jan 1, 2008
1.508
+0.071
4.92%
jan 1, 2009
1.59
+0.082
5.46%
jan 1, 2010
1.683
+0.093
5.84%
jan 1, 2011
1.776
+0.093
5.55%
jan 1, 2012
1.872
+0.096
5.41%
jan 1, 2013
1.948
+0.076
4.06%
jan 1, 2014
1.975
+0.027
1.37%
jan 1, 2015
1.94
-0.034
-1.74%
jan 1, 2016
1.863
-0.077
-3.98%
Ranking of countries by current statistics by years


Comments: