29
/
en
AIzaSyAYiBZKx7MnpbEhh9jyipgxe19OcubqV5w
April 1, 2024
44579
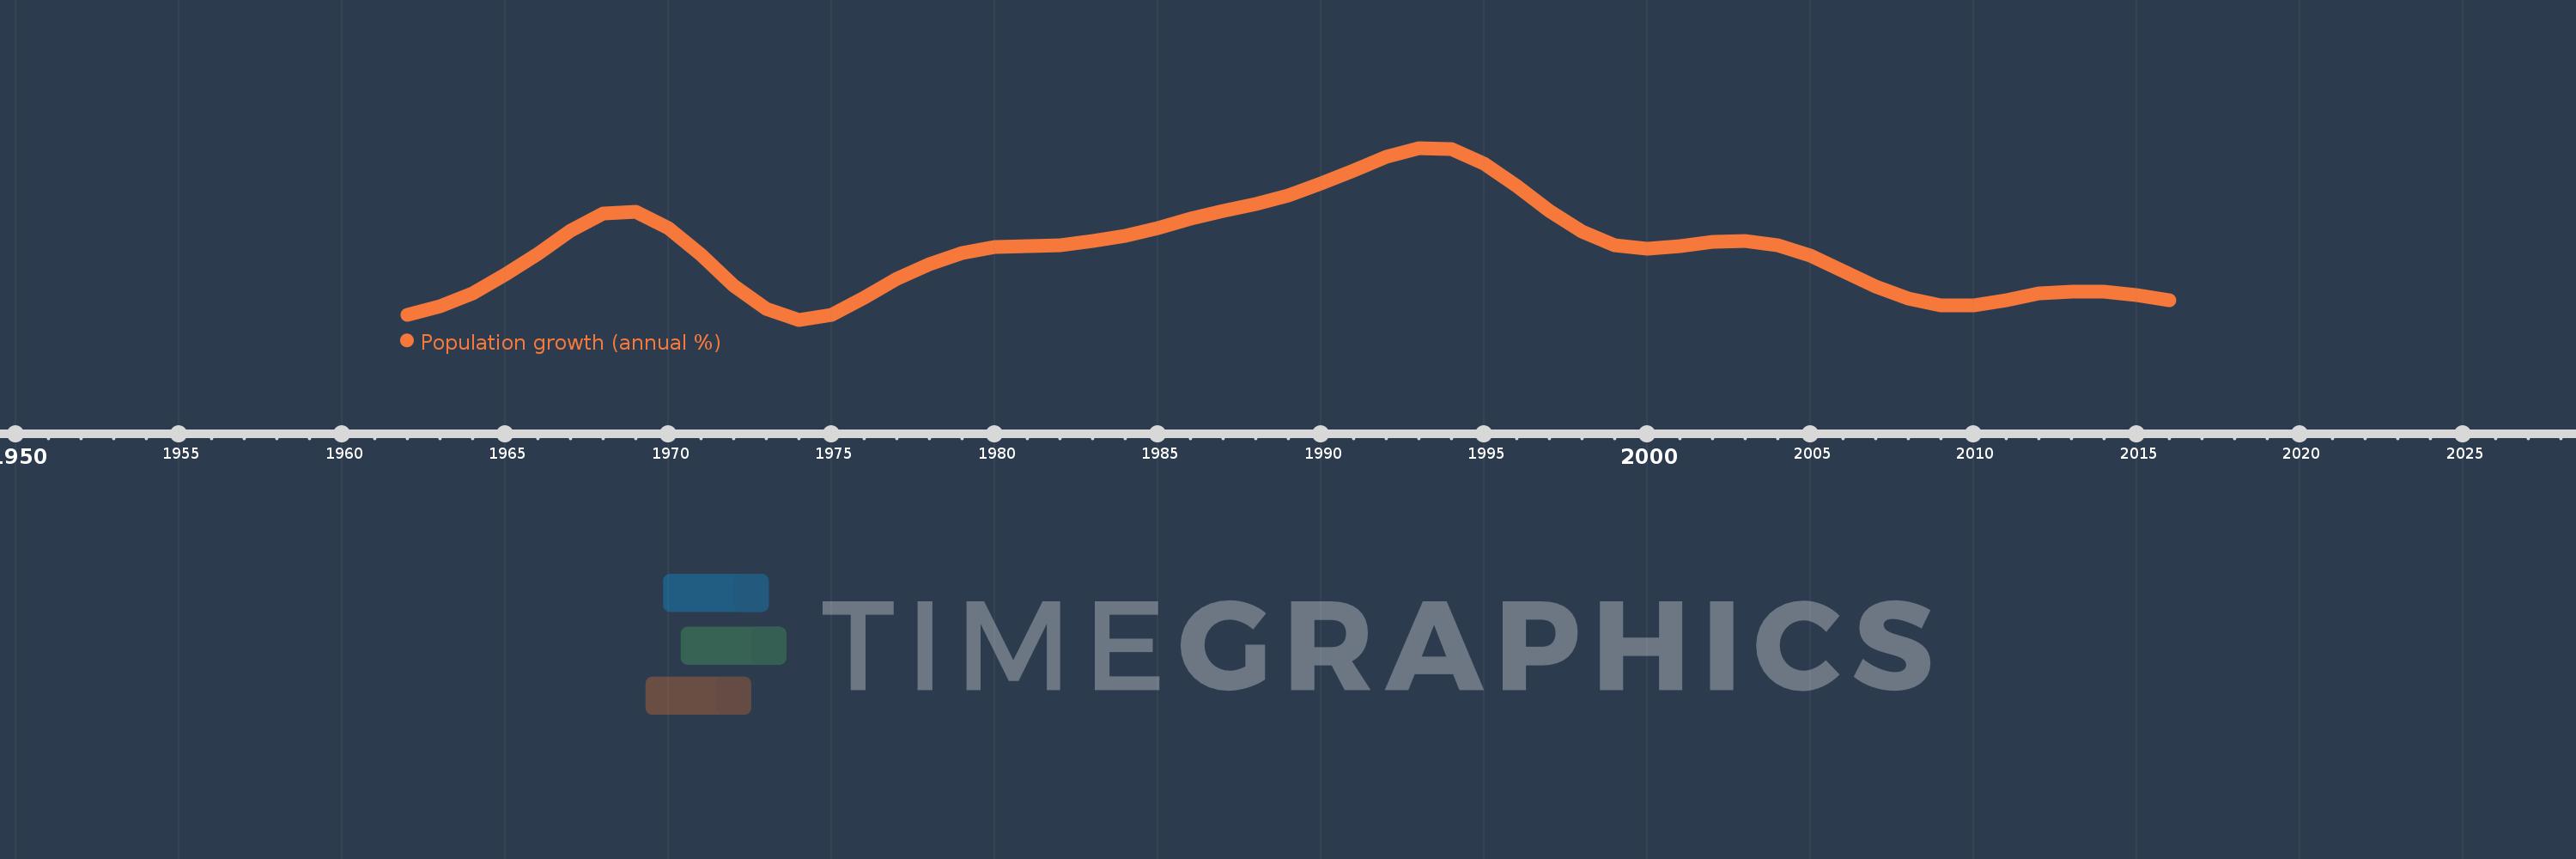
Least developed countries: UN classification
LDC
false
2
1
Population growth (annual %)
2016,2015,2014,2013,2012,2011,2010,2009,2008,2007,2006,2005,2004,2003,2002,2001,2000,1999,1998,1997,1996,1995,1994,1993,1992,1991,1990,1989,1988,1987,1986,1985,1984,1983,1982,1981,1980,1979,1978,1977,1976,1975,1974,1973,1972,1971,1970,1969,1968,1967,1966,1965,1964,1963,1962
This statistics in other country:
AfghanistanAlbaniaAlgeriaAmerican SamoaAndorraAngolaAntigua and BarbudaArab WorldArgentinaArmeniaArubaAustraliaAustriaAzerbaijanBahamas, TheBahrainBangladeshBarbadosBelarusBelgiumBelizeBeninBermudaBhutanBoliviaBosnia and HerzegovinaBotswanaBrazilBritish Virgin IslandsBrunei DarussalamBulgariaBurkina FasoBurundiCabo VerdeCambodiaCameroonCanadaCaribbean small statesCayman IslandsCentral African RepublicCentral Europe and the BalticsChadChannel IslandsChileChinaColombiaComorosCongo, Dem. Rep.Congo, Rep.Costa RicaCote d'IvoireCroatiaCubaCuracaoCyprusCzech RepublicDenmarkDjiboutiDominicaDominican RepublicEarly-demographic dividendEast Asia & PacificEast Asia & Pacific (excluding high income)East Asia & Pacific (IDA & IBRD countries)EcuadorEgypt, Arab Rep.El SalvadorEquatorial GuineaEritreaEstoniaEthiopiaEuro areaEurope & Central AsiaEurope & Central Asia (excluding high income)Europe & Central Asia (IDA & IBRD countries)European UnionFaroe IslandsFijiFinlandFragile and conflict affected situationsFranceFrench PolynesiaGabonGambia, TheGeorgiaGermanyGhanaGibraltarGreeceGreenlandGrenadaGuamGuatemalaGuineaGuinea-BissauGuyanaHaitiHeavily indebted poor countries (HIPC)High incomeHondurasHong Kong SAR, ChinaHungaryIBRD onlyIcelandIDA & IBRD totalIDA blendIDA onlyIDA totalIndiaIndonesiaIran, Islamic Rep.IraqIrelandIsle of ManIsraelItalyJamaicaJapanJordanKazakhstanKenyaKiribatiKorea, Dem. People’s Rep.Korea, Rep.KosovoKuwaitKyrgyz RepublicLao PDRLate-demographic dividendLatin America & Caribbean Latin America & Caribbean (excluding high income)Latin America & the Caribbean (IDA & IBRD countries)LatviaLeast developed countries: UN classificationLebanonLesothoLiberiaLibyaLiechtensteinLithuaniaLow & middle incomeLow incomeLower middle incomeLuxembourgMacao SAR, ChinaMacedonia, FYRMadagascarMalawiMalaysiaMaldivesMaliMaltaMarshall IslandsMauritaniaMauritiusMexicoMicronesia, Fed. Sts.Middle East & North AfricaMiddle East & North Africa (excluding high income)Middle East & North Africa (IDA & IBRD countries)Middle incomeMoldovaMonacoMongoliaMontenegroMoroccoMozambiqueMyanmarNamibiaNauruNepalNetherlandsNew CaledoniaNew ZealandNicaraguaNigerNigeriaNorth AmericaNorthern Mariana IslandsNorwayOECD membersOmanOther small statesPacific island small statesPakistanPalauPanamaPapua New GuineaParaguayPeruPhilippinesPolandPortugalPost-demographic dividendPre-demographic dividendPuerto RicoQatarRomaniaRussian FederationRwandaSamoaSan MarinoSao Tome and PrincipeSaudi ArabiaSenegalSerbiaSeychellesSierra LeoneSingaporeSint Maarten (Dutch part)Slovak RepublicSloveniaSmall statesSolomon IslandsSomaliaSouth AfricaSouth AsiaSouth Asia (IDA & IBRD)South SudanSpainSri LankaSt. Kitts and NevisSt. LuciaSt. Martin (French part)St. Vincent and the GrenadinesSub-Saharan Africa Sub-Saharan Africa (excluding high income)Sub-Saharan Africa (IDA & IBRD countries)SudanSurinameSwazilandSwedenSwitzerlandSyrian Arab RepublicTajikistanTanzaniaThailandTimor-LesteTogoTongaTrinidad and TobagoTunisiaTurkeyTurkmenistanTurks and Caicos IslandsTuvaluUgandaUkraineUnited Arab EmiratesUnited KingdomUnited StatesUpper middle incomeUruguayUzbekistanVanuatuVenezuela, RBVietnamVirgin Islands (U.S.)West Bank and GazaWorldYemen, Rep.ZambiaZimbabwe Timeline:
This timeline shows a graph from 1962 to 2016 of Least developed countries: UN classification. No data until 1961. Number of actual observations by date: 55.
Source name:
World Development Indicators
Source organization:
Derived from total population. Population source: (1) United Nations Population Division. World Population Prospects, (2) United Nations Statistical Division. Population and Vital Statistics Report (various years), (3) Census reports and other statistical
Categories, topics:
Climate Change, Health
Last updated:
apr 23, 2017
Indicators value changes by year
At the date of observation
Value
Absolute change
Change from previous value
jan 1, 1962
2.348
+2.348
0.0%
jan 1, 1963
2.372
+0.024
1.03%
jan 1, 1964
2.409
+0.037
1.55%
jan 1, 1965
2.462
+0.053
2.22%
jan 1, 1966
2.522
+0.06
2.43%
jan 1, 1967
2.588
+0.066
2.61%
jan 1, 1968
2.636
+0.048
1.87%
jan 1, 1969
2.642
+0.006
0.21%
jan 1, 1970
2.595
-0.047
-1.76%
jan 1, 1971
2.518
-0.078
-2.99%
jan 1, 1972
2.431
-0.087
-3.45%
jan 1, 1973
2.364
-0.066
-2.73%
jan 1, 1974
2.334
-0.031
-1.31%
jan 1, 1975
2.349
+0.016
0.67%
jan 1, 1976
2.396
+0.047
1.99%
jan 1, 1977
2.45
+0.054
2.27%
jan 1, 1978
2.493
+0.043
1.76%
jan 1, 1979
2.525
+0.032
1.27%
jan 1, 1980
2.54
+0.015
0.58%
jan 1, 1981
2.544
+0.004
0.16%
jan 1, 1982
2.547
+0.003
0.13%
jan 1, 1983
2.557
+0.01
0.38%
jan 1, 1984
2.572
+0.015
0.6%
jan 1, 1985
2.595
+0.023
0.88%
jan 1, 1986
2.622
+0.027
1.05%
jan 1, 1987
2.644
+0.022
0.84%
jan 1, 1988
2.663
+0.019
0.71%
jan 1, 1989
2.688
+0.026
0.97%
jan 1, 1990
2.723
+0.034
1.27%
jan 1, 1991
2.759
+0.036
1.32%
jan 1, 1992
2.797
+0.038
1.39%
jan 1, 1993
2.823
+0.026
0.92%
jan 1, 1994
2.819
-0.004
-0.15%
jan 1, 1995
2.778
-0.041
-1.44%
jan 1, 1996
2.715
-0.063
-2.26%
jan 1, 1997
2.644
-0.071
-2.6%
jan 1, 1998
2.585
-0.059
-2.24%
jan 1, 1999
2.547
-0.038
-1.49%
jan 1, 2000
2.536
-0.011
-0.42%
jan 1, 2001
2.543
+0.007
0.27%
jan 1, 2002
2.555
+0.012
0.49%
jan 1, 2003
2.558
+0.003
0.13%
jan 1, 2004
2.547
-0.011
-0.44%
jan 1, 2005
2.516
-0.031
-1.21%
jan 1, 2006
2.473
-0.043
-1.72%
jan 1, 2007
2.429
-0.044
-1.77%
jan 1, 2008
2.394
-0.035
-1.44%
jan 1, 2009
2.375
-0.019
-0.81%
jan 1, 2010
2.376
+0.001
0.02%
jan 1, 2011
2.389
+0.013
0.55%
jan 1, 2012
2.408
+0.019
0.81%
jan 1, 2013
2.413
+0.005
0.22%
jan 1, 2014
2.415
+0.001
0.05%
jan 1, 2015
2.405
-0.009
-0.38%
jan 1, 2016
2.389
-0.017
-0.69%
Ranking of countries by current statistics by years


Comments: