29
/
en
AIzaSyAYiBZKx7MnpbEhh9jyipgxe19OcubqV5w
April 1, 2024
88171
Bosnia and Herzegovina
BIH
true
2
1
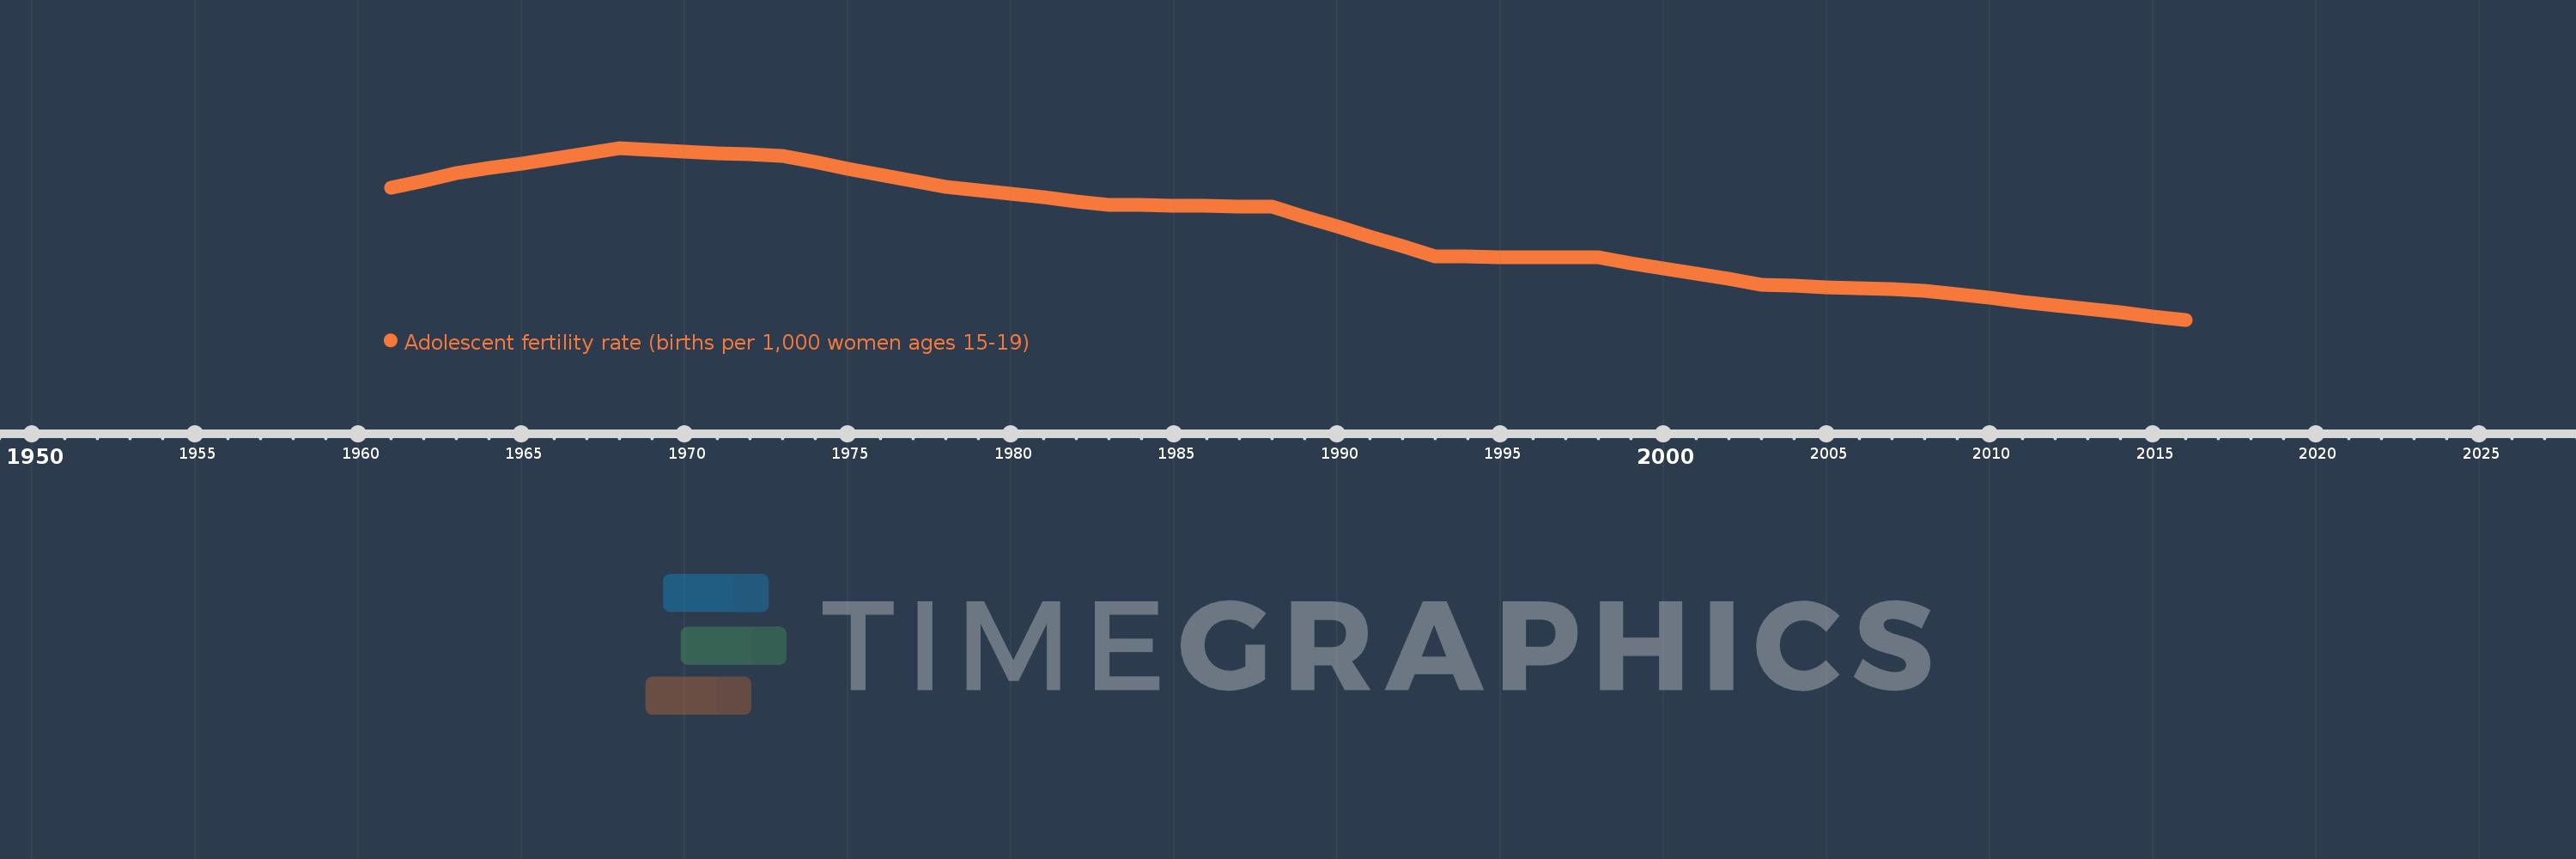
Adolescent fertility rate (births per 1,000 women ages 15-19)
2016,2015,2014,2013,2012,2011,2010,2009,2008,2007,2006,2005,2004,2003,2002,2001,2000,1999,1998,1997,1996,1995,1994,1993,1992,1991,1990,1989,1988,1987,1986,1985,1984,1983,1982,1981,1980,1979,1978,1977,1976,1975,1974,1973,1972,1971,1970,1969,1968,1967,1966,1965,1964,1963,1962,1961
This statistics in other country:
AfghanistanAlbaniaAlgeriaAngolaAntigua and BarbudaArab WorldArgentinaArmeniaArubaAustraliaAustriaAzerbaijanBahamas, TheBahrainBangladeshBarbadosBelarusBelgiumBelizeBeninBhutanBoliviaBosnia and HerzegovinaBotswanaBrazilBrunei DarussalamBulgariaBurkina FasoBurundiCabo VerdeCambodiaCameroonCanadaCaribbean small statesCentral African RepublicCentral Europe and the BalticsChadChannel IslandsChileChinaColombiaComorosCongo, Dem. Rep.Congo, Rep.Costa RicaCote d'IvoireCroatiaCubaCuracaoCyprusCzech RepublicDenmarkDjiboutiDominican RepublicEarly-demographic dividendEast Asia & PacificEast Asia & Pacific (excluding high income)East Asia & Pacific (IDA & IBRD countries)EcuadorEgypt, Arab Rep.El SalvadorEquatorial GuineaEritreaEstoniaEthiopiaEuro areaEurope & Central AsiaEurope & Central Asia (excluding high income)Europe & Central Asia (IDA & IBRD countries)European UnionFijiFinlandFragile and conflict affected situationsFranceFrench PolynesiaGabonGambia, TheGeorgiaGermanyGhanaGreeceGrenadaGuamGuatemalaGuineaGuinea-BissauGuyanaHaitiHeavily indebted poor countries (HIPC)High incomeHondurasHong Kong SAR, ChinaHungaryIBRD onlyIcelandIDA & IBRD totalIDA blendIDA onlyIDA totalIndiaIndonesiaIran, Islamic Rep.IraqIrelandIsraelItalyJamaicaJapanJordanKazakhstanKenyaKiribatiKorea, Dem. People’s Rep.Korea, Rep.KuwaitKyrgyz RepublicLao PDRLate-demographic dividendLatin America & Caribbean Latin America & Caribbean (excluding high income)Latin America & the Caribbean (IDA & IBRD countries)LatviaLeast developed countries: UN classificationLebanonLesothoLiberiaLibyaLithuaniaLow & middle incomeLow incomeLower middle incomeLuxembourgMacao SAR, ChinaMacedonia, FYRMadagascarMalawiMalaysiaMaldivesMaliMaltaMauritaniaMauritiusMexicoMicronesia, Fed. Sts.Middle East & North AfricaMiddle East & North Africa (excluding high income)Middle East & North Africa (IDA & IBRD countries)Middle incomeMoldovaMongoliaMontenegroMoroccoMozambiqueMyanmarNamibiaNepalNetherlandsNew CaledoniaNew ZealandNicaraguaNigerNigeriaNorth AmericaNorwayOECD membersOmanOther small statesPacific island small statesPakistanPanamaPapua New GuineaParaguayPeruPhilippinesPolandPortugalPost-demographic dividendPre-demographic dividendPuerto RicoQatarRomaniaRussian FederationRwandaSamoaSao Tome and PrincipeSaudi ArabiaSenegalSerbiaSeychellesSierra LeoneSingaporeSlovak RepublicSloveniaSmall statesSolomon IslandsSomaliaSouth AfricaSouth AsiaSouth Asia (IDA & IBRD)South SudanSpainSri LankaSt. LuciaSt. Vincent and the GrenadinesSub-Saharan Africa Sub-Saharan Africa (excluding high income)Sub-Saharan Africa (IDA & IBRD countries)SudanSurinameSwazilandSwedenSwitzerlandSyrian Arab RepublicTajikistanTanzaniaThailandTimor-LesteTogoTongaTrinidad and TobagoTunisiaTurkeyTurkmenistanUgandaUkraineUnited Arab EmiratesUnited KingdomUnited StatesUpper middle incomeUruguayUzbekistanVanuatuVenezuela, RBVietnamVirgin Islands (U.S.)West Bank and GazaWorldYemen, Rep.ZambiaZimbabwe Timeline:
This timeline shows a graph from 1961 to 2016 of Bosnia and Herzegovina. No data until 1960. Number of actual observations by date: 56.
Source name:
World Development Indicators
Source organization:
United Nations Population Division, World Population Prospects.
Categories, topics:
Health, Gender, Social Development
Last updated:
apr 23, 2017
Indicators value changes by year
Maximum:
53.214
jan 1, 1968
At the date of observation
Value
Absolute change
Change from previous value
jan 1, 1961
42.748
+42.748
0.0%
jan 1, 1962
44.636
+1.888
4.42%
jan 1, 1963
46.524
+1.888
4.23%
jan 1, 1964
47.862
+1.338
2.88%
jan 1, 1965
49.2
+1.338
2.8%
jan 1, 1966
50.538
+1.338
2.72%
jan 1, 1967
51.876
+1.338
2.65%
jan 1, 1968
53.214
+1.338
2.58%
jan 1, 1969
52.777
-0.437
-0.82%
jan 1, 1970
52.34
-0.437
-0.83%
jan 1, 1971
51.902
-0.437
-0.84%
jan 1, 1972
51.465
-0.437
-0.84%
jan 1, 1973
51.028
-0.437
-0.85%
jan 1, 1974
49.436
-1.592
-3.12%
jan 1, 1975
47.844
-1.592
-3.22%
jan 1, 1976
46.253
-1.592
-3.33%
jan 1, 1977
44.661
-1.592
-3.44%
jan 1, 1978
43.069
-1.592
-3.56%
jan 1, 1979
42.112
-0.957
-2.22%
jan 1, 1980
41.155
-0.957
-2.27%
jan 1, 1981
40.197
-0.957
-2.33%
jan 1, 1982
39.24
-0.957
-2.38%
jan 1, 1983
38.283
-0.957
-2.44%
jan 1, 1984
38.195
-0.088
-0.23%
jan 1, 1985
38.106
-0.088
-0.23%
jan 1, 1986
38.018
-0.088
-0.23%
jan 1, 1987
37.929
-0.088
-0.23%
jan 1, 1988
37.841
-0.088
-0.23%
jan 1, 1989
35.231
-2.61
-6.9%
jan 1, 1990
32.621
-2.61
-7.41%
jan 1, 1991
30.01
-2.61
-8.0%
jan 1, 1992
27.4
-2.61
-8.7%
jan 1, 1993
24.79
-2.61
-9.53%
jan 1, 1994
24.718
-0.072
-0.29%
jan 1, 1995
24.646
-0.072
-0.29%
jan 1, 1996
24.575
-0.072
-0.29%
jan 1, 1997
24.503
-0.072
-0.29%
jan 1, 1998
24.431
-0.072
-0.29%
jan 1, 1999
23.025
-1.406
-5.75%
jan 1, 2000
21.619
-1.406
-6.11%
jan 1, 2001
20.213
-1.406
-6.5%
jan 1, 2002
18.807
-1.406
-6.96%
jan 1, 2003
17.401
-1.406
-7.48%
jan 1, 2004
17.081
-0.32
-1.84%
jan 1, 2005
16.76
-0.32
-1.88%
jan 1, 2006
16.44
-0.32
-1.91%
jan 1, 2007
16.119
-0.32
-1.95%
jan 1, 2008
15.799
-0.32
-1.99%
jan 1, 2009
14.839
-0.96
-6.08%
jan 1, 2010
13.879
-0.96
-6.47%
jan 1, 2011
12.92
-0.96
-6.92%
jan 1, 2012
11.96
-0.96
-7.43%
jan 1, 2013
11.0
-0.96
-8.03%
jan 1, 2014
10.056
-0.944
-8.58%
jan 1, 2015
9.112
-0.944
-9.39%
jan 1, 2016
8.169
-0.944
-10.36%
Ranking of countries by current statistics by years


Comments: