29
/
en
AIzaSyAYiBZKx7MnpbEhh9jyipgxe19OcubqV5w
April 1, 2024
268919
Turkey
TUR
true
2
1
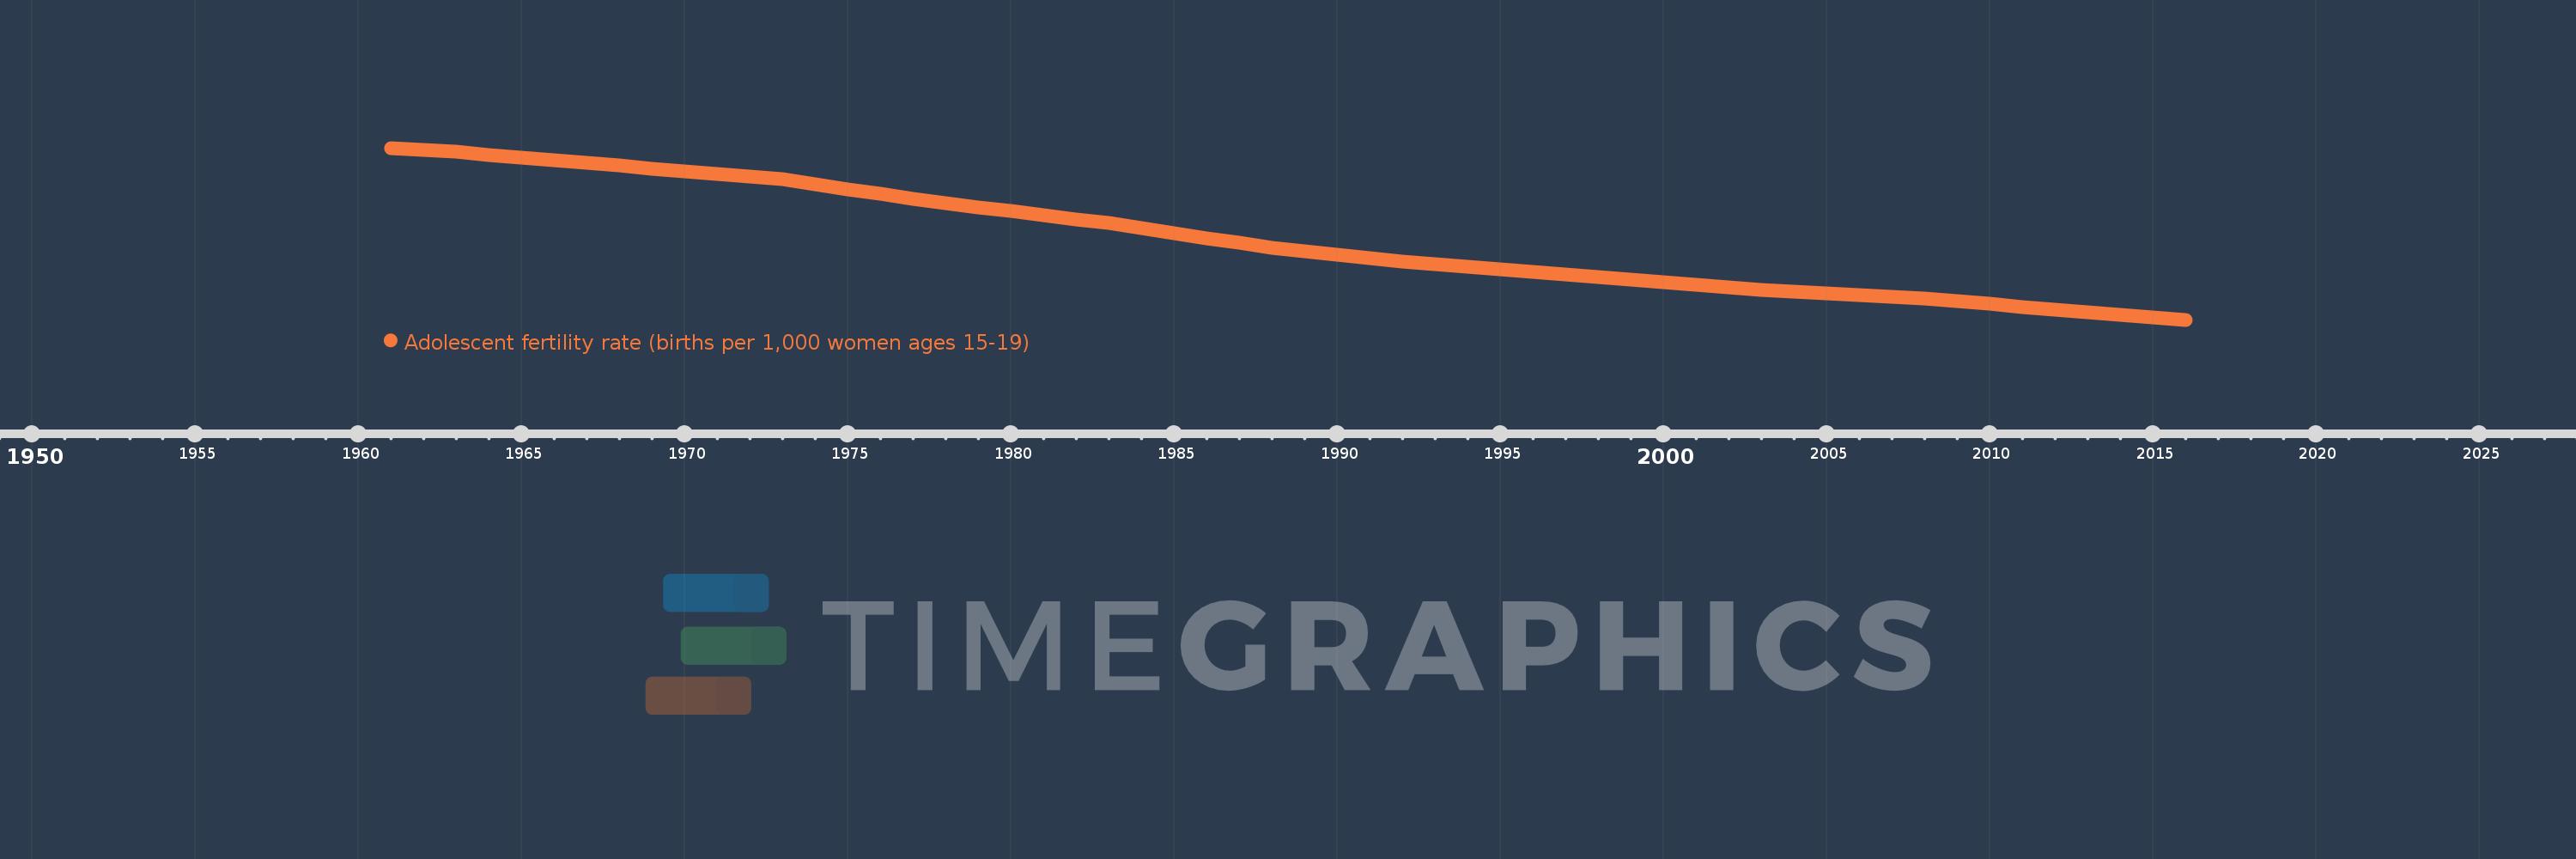
Adolescent fertility rate (births per 1,000 women ages 15-19)
2016,2015,2014,2013,2012,2011,2010,2009,2008,2007,2006,2005,2004,2003,2002,2001,2000,1999,1998,1997,1996,1995,1994,1993,1992,1991,1990,1989,1988,1987,1986,1985,1984,1983,1982,1981,1980,1979,1978,1977,1976,1975,1974,1973,1972,1971,1970,1969,1968,1967,1966,1965,1964,1963,1962,1961
This statistics in other country:
AfghanistanAlbaniaAlgeriaAngolaAntigua and BarbudaArab WorldArgentinaArmeniaArubaAustraliaAustriaAzerbaijanBahamas, TheBahrainBangladeshBarbadosBelarusBelgiumBelizeBeninBhutanBoliviaBosnia and HerzegovinaBotswanaBrazilBrunei DarussalamBulgariaBurkina FasoBurundiCabo VerdeCambodiaCameroonCanadaCaribbean small statesCentral African RepublicCentral Europe and the BalticsChadChannel IslandsChileChinaColombiaComorosCongo, Dem. Rep.Congo, Rep.Costa RicaCote d'IvoireCroatiaCubaCuracaoCyprusCzech RepublicDenmarkDjiboutiDominican RepublicEarly-demographic dividendEast Asia & PacificEast Asia & Pacific (excluding high income)East Asia & Pacific (IDA & IBRD countries)EcuadorEgypt, Arab Rep.El SalvadorEquatorial GuineaEritreaEstoniaEthiopiaEuro areaEurope & Central AsiaEurope & Central Asia (excluding high income)Europe & Central Asia (IDA & IBRD countries)European UnionFijiFinlandFragile and conflict affected situationsFranceFrench PolynesiaGabonGambia, TheGeorgiaGermanyGhanaGreeceGrenadaGuamGuatemalaGuineaGuinea-BissauGuyanaHaitiHeavily indebted poor countries (HIPC)High incomeHondurasHong Kong SAR, ChinaHungaryIBRD onlyIcelandIDA & IBRD totalIDA blendIDA onlyIDA totalIndiaIndonesiaIran, Islamic Rep.IraqIrelandIsraelItalyJamaicaJapanJordanKazakhstanKenyaKiribatiKorea, Dem. People’s Rep.Korea, Rep.KuwaitKyrgyz RepublicLao PDRLate-demographic dividendLatin America & Caribbean Latin America & Caribbean (excluding high income)Latin America & the Caribbean (IDA & IBRD countries)LatviaLeast developed countries: UN classificationLebanonLesothoLiberiaLibyaLithuaniaLow & middle incomeLow incomeLower middle incomeLuxembourgMacao SAR, ChinaMacedonia, FYRMadagascarMalawiMalaysiaMaldivesMaliMaltaMauritaniaMauritiusMexicoMicronesia, Fed. Sts.Middle East & North AfricaMiddle East & North Africa (excluding high income)Middle East & North Africa (IDA & IBRD countries)Middle incomeMoldovaMongoliaMontenegroMoroccoMozambiqueMyanmarNamibiaNepalNetherlandsNew CaledoniaNew ZealandNicaraguaNigerNigeriaNorth AmericaNorwayOECD membersOmanOther small statesPacific island small statesPakistanPanamaPapua New GuineaParaguayPeruPhilippinesPolandPortugalPost-demographic dividendPre-demographic dividendPuerto RicoQatarRomaniaRussian FederationRwandaSamoaSao Tome and PrincipeSaudi ArabiaSenegalSerbiaSeychellesSierra LeoneSingaporeSlovak RepublicSloveniaSmall statesSolomon IslandsSomaliaSouth AfricaSouth AsiaSouth Asia (IDA & IBRD)South SudanSpainSri LankaSt. LuciaSt. Vincent and the GrenadinesSub-Saharan Africa Sub-Saharan Africa (excluding high income)Sub-Saharan Africa (IDA & IBRD countries)SudanSurinameSwazilandSwedenSwitzerlandSyrian Arab RepublicTajikistanTanzaniaThailandTimor-LesteTogoTongaTrinidad and TobagoTunisiaTurkeyTurkmenistanUgandaUkraineUnited Arab EmiratesUnited KingdomUnited StatesUpper middle incomeUruguayUzbekistanVanuatuVenezuela, RBVietnamVirgin Islands (U.S.)West Bank and GazaWorldYemen, Rep.ZambiaZimbabwe Timeline:
This timeline shows a graph from 1961 to 2016 of Turkey. No data until 1960. Number of actual observations by date: 56.
Source name:
World Development Indicators
Source organization:
United Nations Population Division, World Population Prospects.
Categories, topics:
Health, Gender, Social Development
Last updated:
apr 23, 2017
Indicators value changes by year
Minimum:
26.811
jan 1, 2016
Maximum:
132.651
jan 1, 1961
At the date of observation
Value
Absolute change
Change from previous value
jan 1, 1961
132.651
+132.651
0.0%
jan 1, 1962
131.418
-1.233
-0.93%
jan 1, 1963
130.185
-1.233
-0.94%
jan 1, 1964
128.495
-1.69
-1.3%
jan 1, 1965
126.805
-1.69
-1.32%
jan 1, 1966
125.115
-1.69
-1.33%
jan 1, 1967
123.425
-1.69
-1.35%
jan 1, 1968
121.735
-1.69
-1.37%
jan 1, 1969
120.028
-1.707
-1.4%
jan 1, 1970
118.322
-1.707
-1.42%
jan 1, 1971
116.615
-1.707
-1.44%
jan 1, 1972
114.909
-1.707
-1.46%
jan 1, 1973
113.202
-1.707
-1.49%
jan 1, 1974
110.27
-2.932
-2.59%
jan 1, 1975
107.339
-2.932
-2.66%
jan 1, 1976
104.407
-2.932
-2.73%
jan 1, 1977
101.476
-2.932
-2.81%
jan 1, 1978
98.544
-2.932
-2.89%
jan 1, 1979
96.092
-2.452
-2.49%
jan 1, 1980
93.639
-2.452
-2.55%
jan 1, 1981
91.187
-2.452
-2.62%
jan 1, 1982
88.734
-2.452
-2.69%
jan 1, 1983
86.282
-2.452
-2.76%
jan 1, 1984
83.246
-3.036
-3.52%
jan 1, 1985
80.21
-3.036
-3.65%
jan 1, 1986
77.173
-3.036
-3.79%
jan 1, 1987
74.137
-3.036
-3.93%
jan 1, 1988
71.101
-3.036
-4.1%
jan 1, 1989
69.047
-2.054
-2.89%
jan 1, 1990
66.994
-2.054
-2.97%
jan 1, 1991
64.94
-2.054
-3.07%
jan 1, 1992
62.887
-2.054
-3.16%
jan 1, 1993
60.833
-2.054
-3.27%
jan 1, 1994
59.257
-1.576
-2.59%
jan 1, 1995
57.681
-1.576
-2.66%
jan 1, 1996
56.104
-1.576
-2.73%
jan 1, 1997
54.528
-1.576
-2.81%
jan 1, 1998
52.952
-1.576
-2.89%
jan 1, 1999
51.386
-1.566
-2.96%
jan 1, 2000
49.819
-1.566
-3.05%
jan 1, 2001
48.253
-1.566
-3.14%
jan 1, 2002
46.686
-1.566
-3.25%
jan 1, 2003
45.12
-1.566
-3.36%
jan 1, 2004
44.031
-1.089
-2.41%
jan 1, 2005
42.942
-1.089
-2.47%
jan 1, 2006
41.854
-1.089
-2.54%
jan 1, 2007
40.765
-1.089
-2.6%
jan 1, 2008
39.676
-1.089
-2.67%
jan 1, 2009
38.066
-1.61
-4.06%
jan 1, 2010
36.456
-1.61
-4.23%
jan 1, 2011
34.846
-1.61
-4.42%
jan 1, 2012
33.236
-1.61
-4.62%
jan 1, 2013
31.626
-1.61
-4.84%
jan 1, 2014
30.021
-1.605
-5.07%
jan 1, 2015
28.416
-1.605
-5.35%
jan 1, 2016
26.811
-1.605
-5.65%
Ranking of countries by current statistics by years


Comments: