29
/
en
AIzaSyAYiBZKx7MnpbEhh9jyipgxe19OcubqV5w
April 1, 2024
160198
Israel
ISR
true
2
1
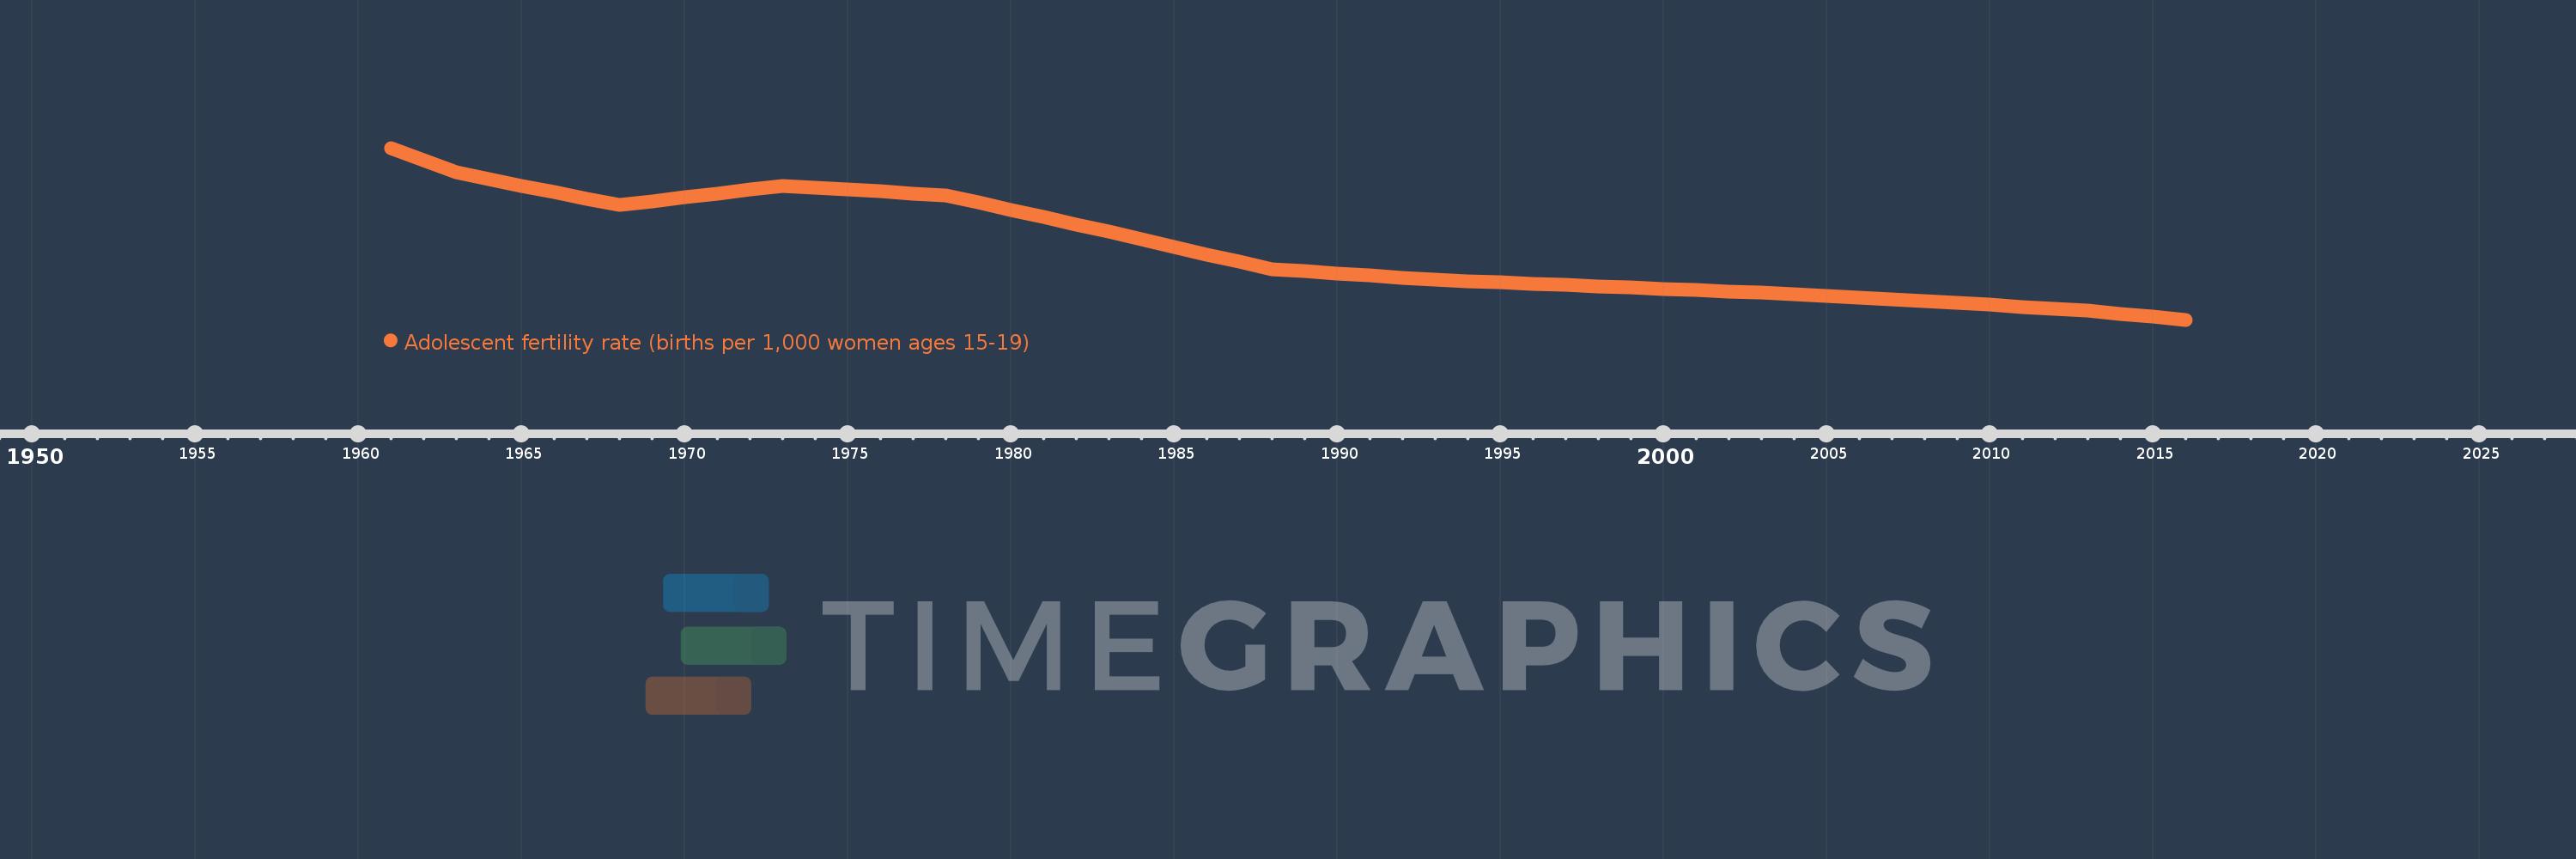
Adolescent fertility rate (births per 1,000 women ages 15-19)
2016,2015,2014,2013,2012,2011,2010,2009,2008,2007,2006,2005,2004,2003,2002,2001,2000,1999,1998,1997,1996,1995,1994,1993,1992,1991,1990,1989,1988,1987,1986,1985,1984,1983,1982,1981,1980,1979,1978,1977,1976,1975,1974,1973,1972,1971,1970,1969,1968,1967,1966,1965,1964,1963,1962,1961
This statistics in other country:
AfghanistanAlbaniaAlgeriaAngolaAntigua and BarbudaArab WorldArgentinaArmeniaArubaAustraliaAustriaAzerbaijanBahamas, TheBahrainBangladeshBarbadosBelarusBelgiumBelizeBeninBhutanBoliviaBosnia and HerzegovinaBotswanaBrazilBrunei DarussalamBulgariaBurkina FasoBurundiCabo VerdeCambodiaCameroonCanadaCaribbean small statesCentral African RepublicCentral Europe and the BalticsChadChannel IslandsChileChinaColombiaComorosCongo, Dem. Rep.Congo, Rep.Costa RicaCote d'IvoireCroatiaCubaCuracaoCyprusCzech RepublicDenmarkDjiboutiDominican RepublicEarly-demographic dividendEast Asia & PacificEast Asia & Pacific (excluding high income)East Asia & Pacific (IDA & IBRD countries)EcuadorEgypt, Arab Rep.El SalvadorEquatorial GuineaEritreaEstoniaEthiopiaEuro areaEurope & Central AsiaEurope & Central Asia (excluding high income)Europe & Central Asia (IDA & IBRD countries)European UnionFijiFinlandFragile and conflict affected situationsFranceFrench PolynesiaGabonGambia, TheGeorgiaGermanyGhanaGreeceGrenadaGuamGuatemalaGuineaGuinea-BissauGuyanaHaitiHeavily indebted poor countries (HIPC)High incomeHondurasHong Kong SAR, ChinaHungaryIBRD onlyIcelandIDA & IBRD totalIDA blendIDA onlyIDA totalIndiaIndonesiaIran, Islamic Rep.IraqIrelandIsraelItalyJamaicaJapanJordanKazakhstanKenyaKiribatiKorea, Dem. People’s Rep.Korea, Rep.KuwaitKyrgyz RepublicLao PDRLate-demographic dividendLatin America & Caribbean Latin America & Caribbean (excluding high income)Latin America & the Caribbean (IDA & IBRD countries)LatviaLeast developed countries: UN classificationLebanonLesothoLiberiaLibyaLithuaniaLow & middle incomeLow incomeLower middle incomeLuxembourgMacao SAR, ChinaMacedonia, FYRMadagascarMalawiMalaysiaMaldivesMaliMaltaMauritaniaMauritiusMexicoMicronesia, Fed. Sts.Middle East & North AfricaMiddle East & North Africa (excluding high income)Middle East & North Africa (IDA & IBRD countries)Middle incomeMoldovaMongoliaMontenegroMoroccoMozambiqueMyanmarNamibiaNepalNetherlandsNew CaledoniaNew ZealandNicaraguaNigerNigeriaNorth AmericaNorwayOECD membersOmanOther small statesPacific island small statesPakistanPanamaPapua New GuineaParaguayPeruPhilippinesPolandPortugalPost-demographic dividendPre-demographic dividendPuerto RicoQatarRomaniaRussian FederationRwandaSamoaSao Tome and PrincipeSaudi ArabiaSenegalSerbiaSeychellesSierra LeoneSingaporeSlovak RepublicSloveniaSmall statesSolomon IslandsSomaliaSouth AfricaSouth AsiaSouth Asia (IDA & IBRD)South SudanSpainSri LankaSt. LuciaSt. Vincent and the GrenadinesSub-Saharan Africa Sub-Saharan Africa (excluding high income)Sub-Saharan Africa (IDA & IBRD countries)SudanSurinameSwazilandSwedenSwitzerlandSyrian Arab RepublicTajikistanTanzaniaThailandTimor-LesteTogoTongaTrinidad and TobagoTunisiaTurkeyTurkmenistanUgandaUkraineUnited Arab EmiratesUnited KingdomUnited StatesUpper middle incomeUruguayUzbekistanVanuatuVenezuela, RBVietnamVirgin Islands (U.S.)West Bank and GazaWorldYemen, Rep.ZambiaZimbabwe Timeline:
This timeline shows a graph from 1961 to 2016 of Israel. No data until 1960. Number of actual observations by date: 56.
Source name:
World Development Indicators
Source organization:
United Nations Population Division, World Population Prospects.
Categories, topics:
Health, Gender, Social Development
Last updated:
apr 23, 2017
Indicators value changes by year
At the date of observation
Value
Absolute change
Change from previous value
jan 1, 1961
52.26
+52.26
0.0%
jan 1, 1962
49.185
-3.076
-5.89%
jan 1, 1963
46.109
-3.076
-6.25%
jan 1, 1964
44.471
-1.638
-3.55%
jan 1, 1965
42.832
-1.638
-3.68%
jan 1, 1966
41.194
-1.638
-3.83%
jan 1, 1967
39.555
-1.638
-3.98%
jan 1, 1968
37.917
-1.638
-4.14%
jan 1, 1969
38.884
+0.967
2.55%
jan 1, 1970
39.851
+0.967
2.49%
jan 1, 1971
40.817
+0.967
2.43%
jan 1, 1972
41.784
+0.967
2.37%
jan 1, 1973
42.751
+0.967
2.31%
jan 1, 1974
42.29
-0.461
-1.08%
jan 1, 1975
41.83
-0.461
-1.09%
jan 1, 1976
41.369
-0.461
-1.1%
jan 1, 1977
40.909
-0.461
-1.11%
jan 1, 1978
40.448
-0.461
-1.13%
jan 1, 1979
38.615
-1.833
-4.53%
jan 1, 1980
36.782
-1.833
-4.75%
jan 1, 1981
34.95
-1.833
-4.98%
jan 1, 1982
33.117
-1.833
-5.24%
jan 1, 1983
31.284
-1.833
-5.53%
jan 1, 1984
29.411
-1.873
-5.99%
jan 1, 1985
27.538
-1.873
-6.37%
jan 1, 1986
25.666
-1.873
-6.8%
jan 1, 1987
23.793
-1.873
-7.3%
jan 1, 1988
21.92
-1.873
-7.87%
jan 1, 1989
21.404
-0.516
-2.35%
jan 1, 1990
20.889
-0.516
-2.41%
jan 1, 1991
20.373
-0.516
-2.47%
jan 1, 1992
19.858
-0.516
-2.53%
jan 1, 1993
19.342
-0.516
-2.6%
jan 1, 1994
19.004
-0.338
-1.75%
jan 1, 1995
18.666
-0.338
-1.78%
jan 1, 1996
18.329
-0.338
-1.81%
jan 1, 1997
17.991
-0.338
-1.84%
jan 1, 1998
17.653
-0.338
-1.88%
jan 1, 1999
17.333
-0.32
-1.81%
jan 1, 2000
17.013
-0.32
-1.85%
jan 1, 2001
16.692
-0.32
-1.88%
jan 1, 2002
16.372
-0.32
-1.92%
jan 1, 2003
16.052
-0.32
-1.96%
jan 1, 2004
15.634
-0.418
-2.61%
jan 1, 2005
15.215
-0.418
-2.68%
jan 1, 2006
14.797
-0.418
-2.75%
jan 1, 2007
14.378
-0.418
-2.83%
jan 1, 2008
13.96
-0.418
-2.91%
jan 1, 2009
13.482
-0.478
-3.43%
jan 1, 2010
13.003
-0.478
-3.55%
jan 1, 2011
12.525
-0.478
-3.68%
jan 1, 2012
12.046
-0.478
-3.82%
jan 1, 2013
11.568
-0.478
-3.97%
jan 1, 2014
10.815
-0.753
-6.51%
jan 1, 2015
10.061
-0.753
-6.97%
jan 1, 2016
9.308
-0.753
-7.49%
Ranking of countries by current statistics by years


Comments: