29
/
en
AIzaSyAYiBZKx7MnpbEhh9jyipgxe19OcubqV5w
April 1, 2024
64278
Albania
ALB
true
2
1
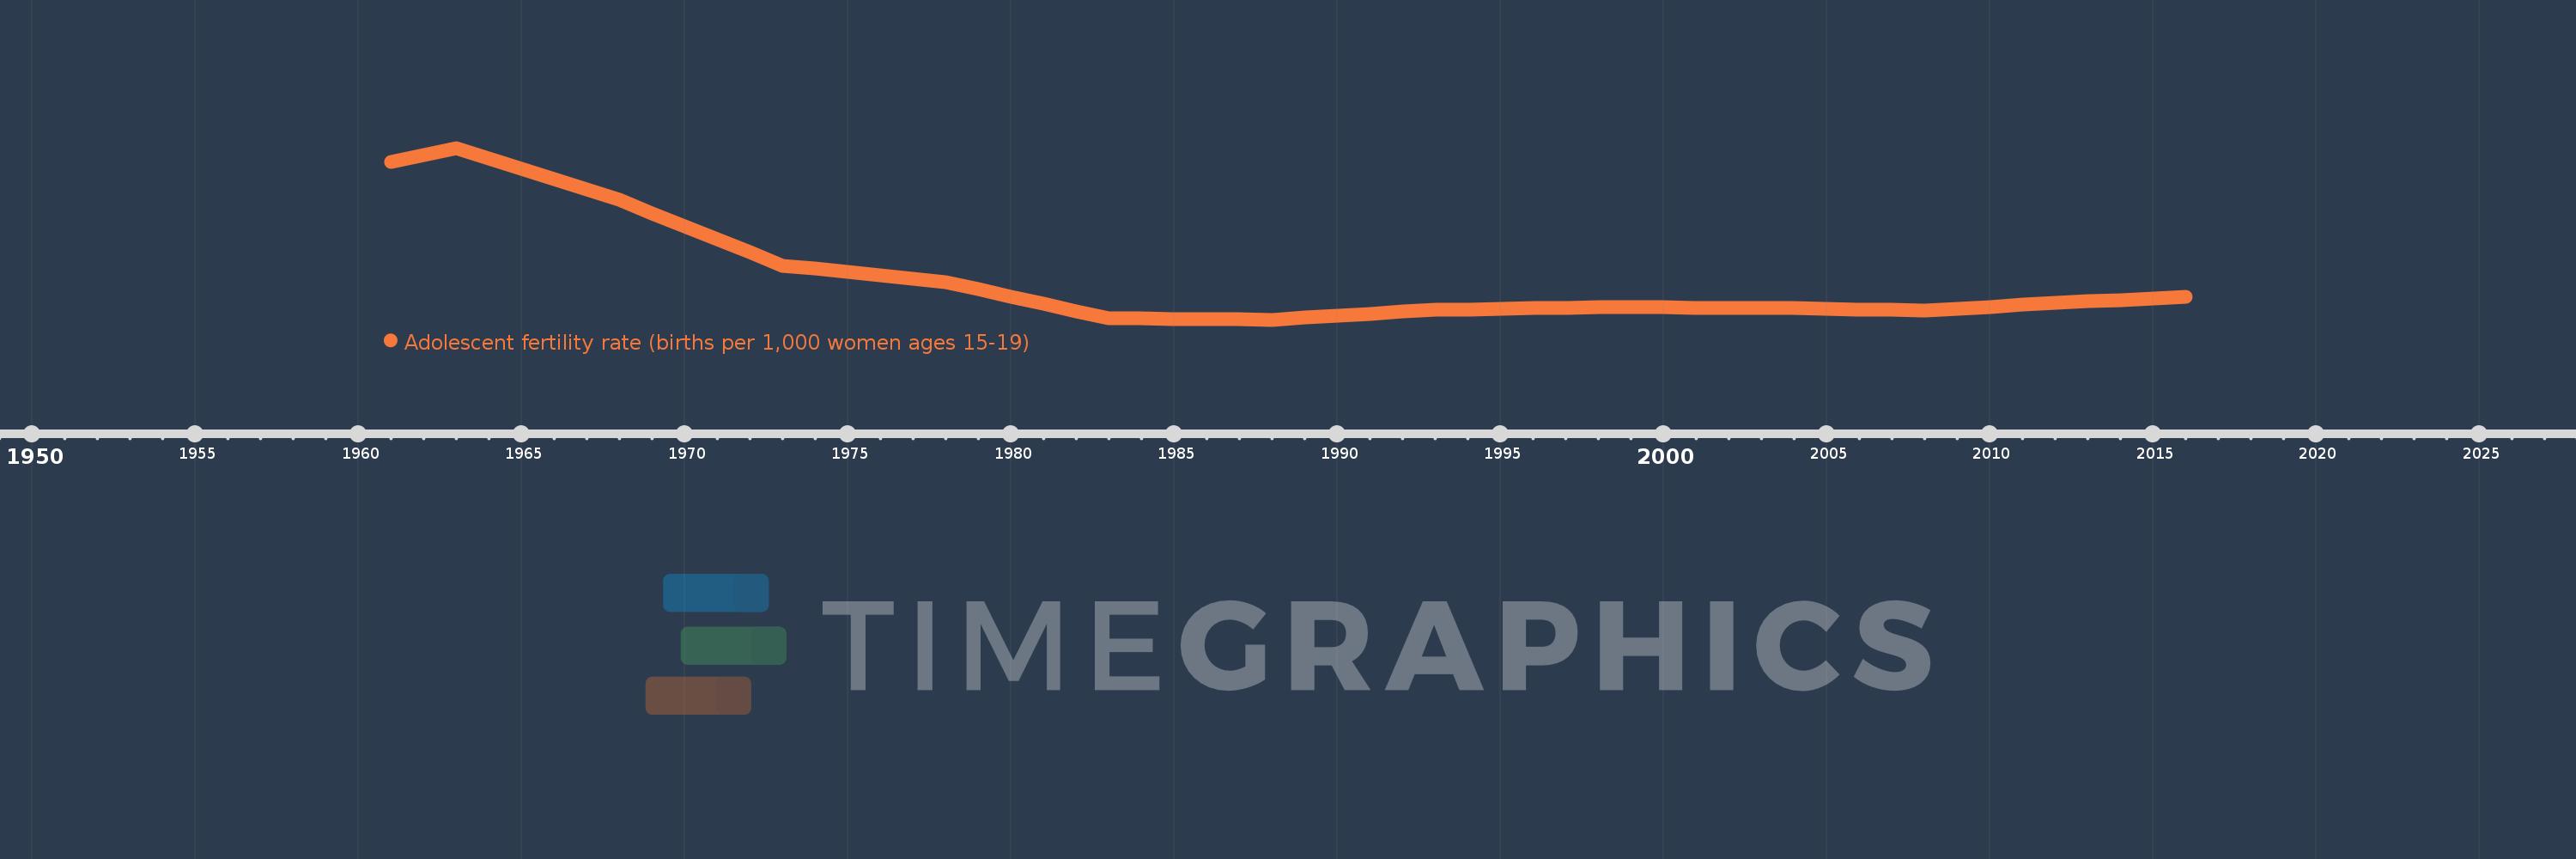
Adolescent fertility rate (births per 1,000 women ages 15-19)
2016,2015,2014,2013,2012,2011,2010,2009,2008,2007,2006,2005,2004,2003,2002,2001,2000,1999,1998,1997,1996,1995,1994,1993,1992,1991,1990,1989,1988,1987,1986,1985,1984,1983,1982,1981,1980,1979,1978,1977,1976,1975,1974,1973,1972,1971,1970,1969,1968,1967,1966,1965,1964,1963,1962,1961
This statistics in other country:
AfghanistanAlbaniaAlgeriaAngolaAntigua and BarbudaArab WorldArgentinaArmeniaArubaAustraliaAustriaAzerbaijanBahamas, TheBahrainBangladeshBarbadosBelarusBelgiumBelizeBeninBhutanBoliviaBosnia and HerzegovinaBotswanaBrazilBrunei DarussalamBulgariaBurkina FasoBurundiCabo VerdeCambodiaCameroonCanadaCaribbean small statesCentral African RepublicCentral Europe and the BalticsChadChannel IslandsChileChinaColombiaComorosCongo, Dem. Rep.Congo, Rep.Costa RicaCote d'IvoireCroatiaCubaCuracaoCyprusCzech RepublicDenmarkDjiboutiDominican RepublicEarly-demographic dividendEast Asia & PacificEast Asia & Pacific (excluding high income)East Asia & Pacific (IDA & IBRD countries)EcuadorEgypt, Arab Rep.El SalvadorEquatorial GuineaEritreaEstoniaEthiopiaEuro areaEurope & Central AsiaEurope & Central Asia (excluding high income)Europe & Central Asia (IDA & IBRD countries)European UnionFijiFinlandFragile and conflict affected situationsFranceFrench PolynesiaGabonGambia, TheGeorgiaGermanyGhanaGreeceGrenadaGuamGuatemalaGuineaGuinea-BissauGuyanaHaitiHeavily indebted poor countries (HIPC)High incomeHondurasHong Kong SAR, ChinaHungaryIBRD onlyIcelandIDA & IBRD totalIDA blendIDA onlyIDA totalIndiaIndonesiaIran, Islamic Rep.IraqIrelandIsraelItalyJamaicaJapanJordanKazakhstanKenyaKiribatiKorea, Dem. People’s Rep.Korea, Rep.KuwaitKyrgyz RepublicLao PDRLate-demographic dividendLatin America & Caribbean Latin America & Caribbean (excluding high income)Latin America & the Caribbean (IDA & IBRD countries)LatviaLeast developed countries: UN classificationLebanonLesothoLiberiaLibyaLithuaniaLow & middle incomeLow incomeLower middle incomeLuxembourgMacao SAR, ChinaMacedonia, FYRMadagascarMalawiMalaysiaMaldivesMaliMaltaMauritaniaMauritiusMexicoMicronesia, Fed. Sts.Middle East & North AfricaMiddle East & North Africa (excluding high income)Middle East & North Africa (IDA & IBRD countries)Middle incomeMoldovaMongoliaMontenegroMoroccoMozambiqueMyanmarNamibiaNepalNetherlandsNew CaledoniaNew ZealandNicaraguaNigerNigeriaNorth AmericaNorwayOECD membersOmanOther small statesPacific island small statesPakistanPanamaPapua New GuineaParaguayPeruPhilippinesPolandPortugalPost-demographic dividendPre-demographic dividendPuerto RicoQatarRomaniaRussian FederationRwandaSamoaSao Tome and PrincipeSaudi ArabiaSenegalSerbiaSeychellesSierra LeoneSingaporeSlovak RepublicSloveniaSmall statesSolomon IslandsSomaliaSouth AfricaSouth AsiaSouth Asia (IDA & IBRD)South SudanSpainSri LankaSt. LuciaSt. Vincent and the GrenadinesSub-Saharan Africa Sub-Saharan Africa (excluding high income)Sub-Saharan Africa (IDA & IBRD countries)SudanSurinameSwazilandSwedenSwitzerlandSyrian Arab RepublicTajikistanTanzaniaThailandTimor-LesteTogoTongaTrinidad and TobagoTunisiaTurkeyTurkmenistanUgandaUkraineUnited Arab EmiratesUnited KingdomUnited StatesUpper middle incomeUruguayUzbekistanVanuatuVenezuela, RBVietnamVirgin Islands (U.S.)West Bank and GazaWorldYemen, Rep.ZambiaZimbabwe Timeline:
This timeline shows a graph from 1961 to 2016 of Albania. No data until 1960. Number of actual observations by date: 56.
Source name:
World Development Indicators
Source organization:
United Nations Population Division, World Population Prospects.
Categories, topics:
Health, Gender, Social Development
Last updated:
apr 23, 2017
Indicators value changes by year
Minimum:
16.342
jan 1, 1988
At the date of observation
Value
Absolute change
Change from previous value
jan 1, 1961
54.441
+54.441
0.0%
jan 1, 1962
56.165
+1.725
3.17%
jan 1, 1963
57.89
+1.725
3.07%
jan 1, 1964
55.368
-2.522
-4.36%
jan 1, 1965
52.846
-2.522
-4.55%
jan 1, 1966
50.324
-2.522
-4.77%
jan 1, 1967
47.802
-2.522
-5.01%
jan 1, 1968
45.28
-2.522
-5.28%
jan 1, 1969
42.118
-3.162
-6.98%
jan 1, 1970
38.955
-3.162
-7.51%
jan 1, 1971
35.793
-3.162
-8.12%
jan 1, 1972
32.63
-3.162
-8.84%
jan 1, 1973
29.468
-3.162
-9.69%
jan 1, 1974
28.655
-0.813
-2.76%
jan 1, 1975
27.843
-0.813
-2.84%
jan 1, 1976
27.03
-0.813
-2.92%
jan 1, 1977
26.218
-0.813
-3.01%
jan 1, 1978
25.405
-0.813
-3.1%
jan 1, 1979
23.668
-1.737
-6.84%
jan 1, 1980
21.93
-1.737
-7.34%
jan 1, 1981
20.193
-1.737
-7.92%
jan 1, 1982
18.455
-1.737
-8.6%
jan 1, 1983
16.718
-1.737
-9.41%
jan 1, 1984
16.643
-0.075
-0.45%
jan 1, 1985
16.568
-0.075
-0.45%
jan 1, 1986
16.492
-0.075
-0.45%
jan 1, 1987
16.417
-0.075
-0.46%
jan 1, 1988
16.342
-0.075
-0.46%
jan 1, 1989
16.82
+0.478
2.93%
jan 1, 1990
17.298
+0.478
2.84%
jan 1, 1991
17.777
+0.478
2.76%
jan 1, 1992
18.255
+0.478
2.69%
jan 1, 1993
18.733
+0.478
2.62%
jan 1, 1994
18.852
+0.119
0.64%
jan 1, 1995
18.972
+0.119
0.63%
jan 1, 1996
19.091
+0.119
0.63%
jan 1, 1997
19.211
+0.119
0.63%
jan 1, 1998
19.33
+0.119
0.62%
jan 1, 1999
19.311
-0.019
-0.1%
jan 1, 2000
19.292
-0.019
-0.1%
jan 1, 2001
19.273
-0.019
-0.1%
jan 1, 2002
19.254
-0.019
-0.1%
jan 1, 2003
19.235
-0.019
-0.1%
jan 1, 2004
19.108
-0.127
-0.66%
jan 1, 2005
18.981
-0.127
-0.66%
jan 1, 2006
18.854
-0.127
-0.67%
jan 1, 2007
18.727
-0.127
-0.67%
jan 1, 2008
18.6
-0.127
-0.68%
jan 1, 2009
19.04
+0.44
2.36%
jan 1, 2010
19.479
+0.44
2.31%
jan 1, 2011
19.919
+0.44
2.26%
jan 1, 2012
20.358
+0.44
2.21%
jan 1, 2013
20.798
+0.44
2.16%
jan 1, 2014
21.144
+0.346
1.66%
jan 1, 2015
21.49
+0.346
1.64%
jan 1, 2016
21.835
+0.346
1.61%
Ranking of countries by current statistics by years


Comments: