29
/
en
AIzaSyAYiBZKx7MnpbEhh9jyipgxe19OcubqV5w
April 1, 2024
278455
Uzbekistan
UZB
true
2
1
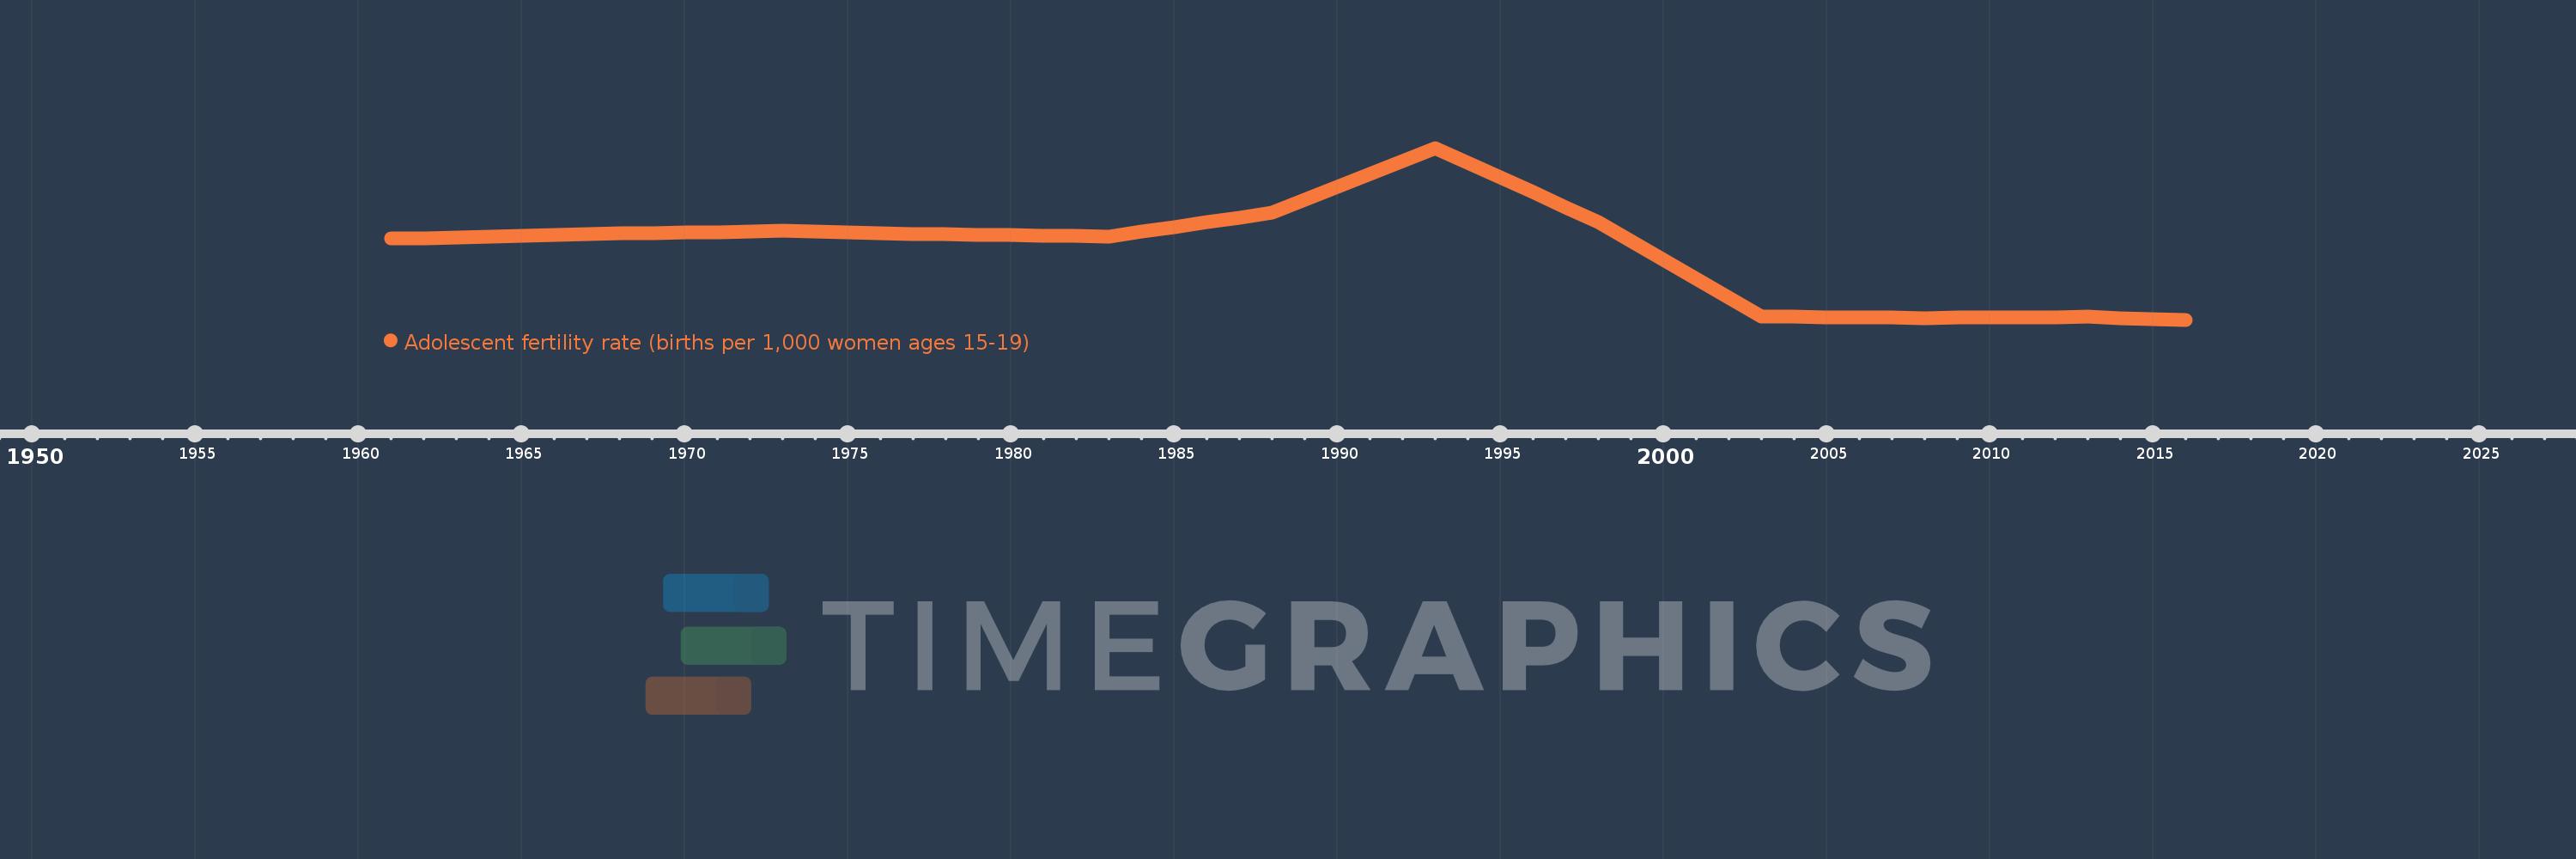
Adolescent fertility rate (births per 1,000 women ages 15-19)
2016,2015,2014,2013,2012,2011,2010,2009,2008,2007,2006,2005,2004,2003,2002,2001,2000,1999,1998,1997,1996,1995,1994,1993,1992,1991,1990,1989,1988,1987,1986,1985,1984,1983,1982,1981,1980,1979,1978,1977,1976,1975,1974,1973,1972,1971,1970,1969,1968,1967,1966,1965,1964,1963,1962,1961
This statistics in other country:
AfghanistanAlbaniaAlgeriaAngolaAntigua and BarbudaArab WorldArgentinaArmeniaArubaAustraliaAustriaAzerbaijanBahamas, TheBahrainBangladeshBarbadosBelarusBelgiumBelizeBeninBhutanBoliviaBosnia and HerzegovinaBotswanaBrazilBrunei DarussalamBulgariaBurkina FasoBurundiCabo VerdeCambodiaCameroonCanadaCaribbean small statesCentral African RepublicCentral Europe and the BalticsChadChannel IslandsChileChinaColombiaComorosCongo, Dem. Rep.Congo, Rep.Costa RicaCote d'IvoireCroatiaCubaCuracaoCyprusCzech RepublicDenmarkDjiboutiDominican RepublicEarly-demographic dividendEast Asia & PacificEast Asia & Pacific (excluding high income)East Asia & Pacific (IDA & IBRD countries)EcuadorEgypt, Arab Rep.El SalvadorEquatorial GuineaEritreaEstoniaEthiopiaEuro areaEurope & Central AsiaEurope & Central Asia (excluding high income)Europe & Central Asia (IDA & IBRD countries)European UnionFijiFinlandFragile and conflict affected situationsFranceFrench PolynesiaGabonGambia, TheGeorgiaGermanyGhanaGreeceGrenadaGuamGuatemalaGuineaGuinea-BissauGuyanaHaitiHeavily indebted poor countries (HIPC)High incomeHondurasHong Kong SAR, ChinaHungaryIBRD onlyIcelandIDA & IBRD totalIDA blendIDA onlyIDA totalIndiaIndonesiaIran, Islamic Rep.IraqIrelandIsraelItalyJamaicaJapanJordanKazakhstanKenyaKiribatiKorea, Dem. People’s Rep.Korea, Rep.KuwaitKyrgyz RepublicLao PDRLate-demographic dividendLatin America & Caribbean Latin America & Caribbean (excluding high income)Latin America & the Caribbean (IDA & IBRD countries)LatviaLeast developed countries: UN classificationLebanonLesothoLiberiaLibyaLithuaniaLow & middle incomeLow incomeLower middle incomeLuxembourgMacao SAR, ChinaMacedonia, FYRMadagascarMalawiMalaysiaMaldivesMaliMaltaMauritaniaMauritiusMexicoMicronesia, Fed. Sts.Middle East & North AfricaMiddle East & North Africa (excluding high income)Middle East & North Africa (IDA & IBRD countries)Middle incomeMoldovaMongoliaMontenegroMoroccoMozambiqueMyanmarNamibiaNepalNetherlandsNew CaledoniaNew ZealandNicaraguaNigerNigeriaNorth AmericaNorwayOECD membersOmanOther small statesPacific island small statesPakistanPanamaPapua New GuineaParaguayPeruPhilippinesPolandPortugalPost-demographic dividendPre-demographic dividendPuerto RicoQatarRomaniaRussian FederationRwandaSamoaSao Tome and PrincipeSaudi ArabiaSenegalSerbiaSeychellesSierra LeoneSingaporeSlovak RepublicSloveniaSmall statesSolomon IslandsSomaliaSouth AfricaSouth AsiaSouth Asia (IDA & IBRD)South SudanSpainSri LankaSt. LuciaSt. Vincent and the GrenadinesSub-Saharan Africa Sub-Saharan Africa (excluding high income)Sub-Saharan Africa (IDA & IBRD countries)SudanSurinameSwazilandSwedenSwitzerlandSyrian Arab RepublicTajikistanTanzaniaThailandTimor-LesteTogoTongaTrinidad and TobagoTunisiaTurkeyTurkmenistanUgandaUkraineUnited Arab EmiratesUnited KingdomUnited StatesUpper middle incomeUruguayUzbekistanVanuatuVenezuela, RBVietnamVirgin Islands (U.S.)West Bank and GazaWorldYemen, Rep.ZambiaZimbabwe Timeline:
This timeline shows a graph from 1961 to 2016 of Uzbekistan. No data until 1960. Number of actual observations by date: 56.
Source name:
World Development Indicators
Source organization:
United Nations Population Division, World Population Prospects.
Categories, topics:
Health, Gender, Social Development
Last updated:
apr 23, 2017
Indicators value changes by year
Maximum:
58.055
jan 1, 1993
At the date of observation
Value
Absolute change
Change from previous value
jan 1, 1961
36.704
+36.704
0.0%
jan 1, 1962
36.841
+0.137
0.37%
jan 1, 1963
36.978
+0.137
0.37%
jan 1, 1964
37.16
+0.182
0.49%
jan 1, 1965
37.342
+0.182
0.49%
jan 1, 1966
37.524
+0.182
0.49%
jan 1, 1967
37.706
+0.182
0.49%
jan 1, 1968
37.888
+0.182
0.48%
jan 1, 1969
38.008
+0.12
0.32%
jan 1, 1970
38.128
+0.12
0.32%
jan 1, 1971
38.249
+0.12
0.32%
jan 1, 1972
38.369
+0.12
0.31%
jan 1, 1973
38.489
+0.12
0.31%
jan 1, 1974
38.325
-0.164
-0.43%
jan 1, 1975
38.162
-0.164
-0.43%
jan 1, 1976
37.998
-0.164
-0.43%
jan 1, 1977
37.835
-0.164
-0.43%
jan 1, 1978
37.671
-0.164
-0.43%
jan 1, 1979
37.571
-0.1
-0.27%
jan 1, 1980
37.471
-0.1
-0.27%
jan 1, 1981
37.37
-0.1
-0.27%
jan 1, 1982
37.27
-0.1
-0.27%
jan 1, 1983
37.17
-0.1
-0.27%
jan 1, 1984
38.299
+1.129
3.04%
jan 1, 1985
39.427
+1.129
2.95%
jan 1, 1986
40.556
+1.129
2.86%
jan 1, 1987
41.684
+1.129
2.78%
jan 1, 1988
42.813
+1.129
2.71%
jan 1, 1989
45.861
+3.048
7.12%
jan 1, 1990
48.91
+3.048
6.65%
jan 1, 1991
51.958
+3.048
6.23%
jan 1, 1992
55.007
+3.048
5.87%
jan 1, 1993
58.055
+3.048
5.54%
jan 1, 1994
54.566
-3.489
-6.01%
jan 1, 1995
51.078
-3.489
-6.39%
jan 1, 1996
47.589
-3.489
-6.83%
jan 1, 1997
44.101
-3.489
-7.33%
jan 1, 1998
40.612
-3.489
-7.91%
jan 1, 1999
36.158
-4.454
-10.97%
jan 1, 2000
31.704
-4.454
-12.32%
jan 1, 2001
27.25
-4.454
-14.05%
jan 1, 2002
22.796
-4.454
-16.34%
jan 1, 2003
18.342
-4.454
-19.54%
jan 1, 2004
18.275
-0.067
-0.37%
jan 1, 2005
18.208
-0.067
-0.37%
jan 1, 2006
18.14
-0.067
-0.37%
jan 1, 2007
18.073
-0.067
-0.37%
jan 1, 2008
18.006
-0.067
-0.37%
jan 1, 2009
18.055
+0.049
0.27%
jan 1, 2010
18.105
+0.049
0.27%
jan 1, 2011
18.154
+0.049
0.27%
jan 1, 2012
18.204
+0.049
0.27%
jan 1, 2013
18.253
+0.049
0.27%
jan 1, 2014
18.035
-0.218
-1.19%
jan 1, 2015
17.818
-0.218
-1.21%
jan 1, 2016
17.6
-0.218
-1.22%
Ranking of countries by current statistics by years


Comments: