29
/
en
AIzaSyAYiBZKx7MnpbEhh9jyipgxe19OcubqV5w
April 1, 2024
241292
Slovak Republic
SVK
true
2
1
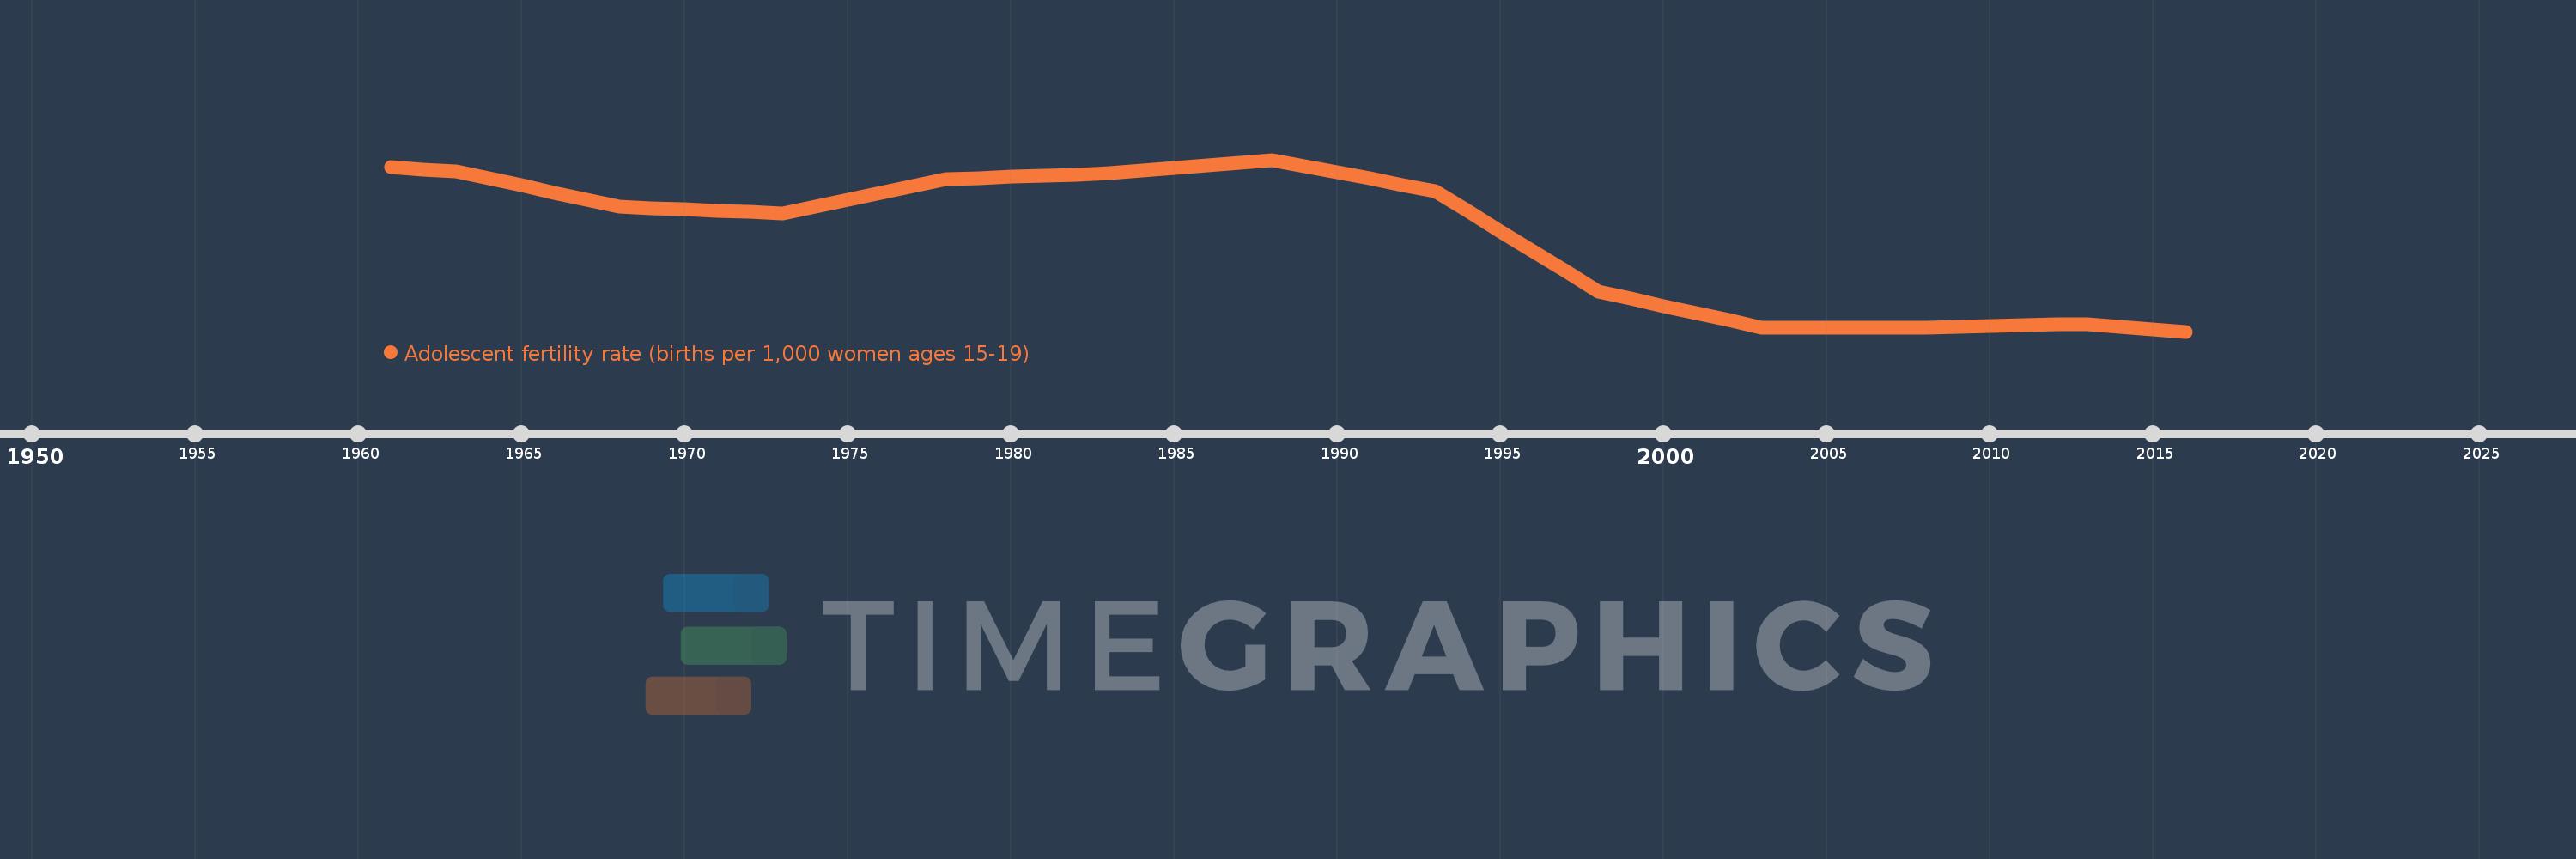
Adolescent fertility rate (births per 1,000 women ages 15-19)
2016,2015,2014,2013,2012,2011,2010,2009,2008,2007,2006,2005,2004,2003,2002,2001,2000,1999,1998,1997,1996,1995,1994,1993,1992,1991,1990,1989,1988,1987,1986,1985,1984,1983,1982,1981,1980,1979,1978,1977,1976,1975,1974,1973,1972,1971,1970,1969,1968,1967,1966,1965,1964,1963,1962,1961
This statistics in other country:
AfghanistanAlbaniaAlgeriaAngolaAntigua and BarbudaArab WorldArgentinaArmeniaArubaAustraliaAustriaAzerbaijanBahamas, TheBahrainBangladeshBarbadosBelarusBelgiumBelizeBeninBhutanBoliviaBosnia and HerzegovinaBotswanaBrazilBrunei DarussalamBulgariaBurkina FasoBurundiCabo VerdeCambodiaCameroonCanadaCaribbean small statesCentral African RepublicCentral Europe and the BalticsChadChannel IslandsChileChinaColombiaComorosCongo, Dem. Rep.Congo, Rep.Costa RicaCote d'IvoireCroatiaCubaCuracaoCyprusCzech RepublicDenmarkDjiboutiDominican RepublicEarly-demographic dividendEast Asia & PacificEast Asia & Pacific (excluding high income)East Asia & Pacific (IDA & IBRD countries)EcuadorEgypt, Arab Rep.El SalvadorEquatorial GuineaEritreaEstoniaEthiopiaEuro areaEurope & Central AsiaEurope & Central Asia (excluding high income)Europe & Central Asia (IDA & IBRD countries)European UnionFijiFinlandFragile and conflict affected situationsFranceFrench PolynesiaGabonGambia, TheGeorgiaGermanyGhanaGreeceGrenadaGuamGuatemalaGuineaGuinea-BissauGuyanaHaitiHeavily indebted poor countries (HIPC)High incomeHondurasHong Kong SAR, ChinaHungaryIBRD onlyIcelandIDA & IBRD totalIDA blendIDA onlyIDA totalIndiaIndonesiaIran, Islamic Rep.IraqIrelandIsraelItalyJamaicaJapanJordanKazakhstanKenyaKiribatiKorea, Dem. People’s Rep.Korea, Rep.KuwaitKyrgyz RepublicLao PDRLate-demographic dividendLatin America & Caribbean Latin America & Caribbean (excluding high income)Latin America & the Caribbean (IDA & IBRD countries)LatviaLeast developed countries: UN classificationLebanonLesothoLiberiaLibyaLithuaniaLow & middle incomeLow incomeLower middle incomeLuxembourgMacao SAR, ChinaMacedonia, FYRMadagascarMalawiMalaysiaMaldivesMaliMaltaMauritaniaMauritiusMexicoMicronesia, Fed. Sts.Middle East & North AfricaMiddle East & North Africa (excluding high income)Middle East & North Africa (IDA & IBRD countries)Middle incomeMoldovaMongoliaMontenegroMoroccoMozambiqueMyanmarNamibiaNepalNetherlandsNew CaledoniaNew ZealandNicaraguaNigerNigeriaNorth AmericaNorwayOECD membersOmanOther small statesPacific island small statesPakistanPanamaPapua New GuineaParaguayPeruPhilippinesPolandPortugalPost-demographic dividendPre-demographic dividendPuerto RicoQatarRomaniaRussian FederationRwandaSamoaSao Tome and PrincipeSaudi ArabiaSenegalSerbiaSeychellesSierra LeoneSingaporeSlovak RepublicSloveniaSmall statesSolomon IslandsSomaliaSouth AfricaSouth AsiaSouth Asia (IDA & IBRD)South SudanSpainSri LankaSt. LuciaSt. Vincent and the GrenadinesSub-Saharan Africa Sub-Saharan Africa (excluding high income)Sub-Saharan Africa (IDA & IBRD countries)SudanSurinameSwazilandSwedenSwitzerlandSyrian Arab RepublicTajikistanTanzaniaThailandTimor-LesteTogoTongaTrinidad and TobagoTunisiaTurkeyTurkmenistanUgandaUkraineUnited Arab EmiratesUnited KingdomUnited StatesUpper middle incomeUruguayUzbekistanVanuatuVenezuela, RBVietnamVirgin Islands (U.S.)West Bank and GazaWorldYemen, Rep.ZambiaZimbabwe Timeline:
This timeline shows a graph from 1961 to 2016 of Slovak Republic. No data until 1960. Number of actual observations by date: 56.
Source name:
World Development Indicators
Source organization:
United Nations Population Division, World Population Prospects.
Categories, topics:
Health, Gender, Social Development
Last updated:
apr 23, 2017
Indicators value changes by year
Maximum:
51.017
jan 1, 1988
At the date of observation
Value
Absolute change
Change from previous value
jan 1, 1961
49.636
+49.636
0.0%
jan 1, 1962
49.3
-0.337
-0.68%
jan 1, 1963
48.963
-0.337
-0.68%
jan 1, 1964
47.678
-1.285
-2.63%
jan 1, 1965
46.392
-1.285
-2.7%
jan 1, 1966
45.107
-1.285
-2.77%
jan 1, 1967
43.821
-1.285
-2.85%
jan 1, 1968
42.536
-1.285
-2.93%
jan 1, 1969
42.3
-0.236
-0.55%
jan 1, 1970
42.064
-0.236
-0.56%
jan 1, 1971
41.828
-0.236
-0.56%
jan 1, 1972
41.592
-0.236
-0.56%
jan 1, 1973
41.356
-0.236
-0.57%
jan 1, 1974
42.588
+1.232
2.98%
jan 1, 1975
43.82
+1.232
2.89%
jan 1, 1976
45.052
+1.232
2.81%
jan 1, 1977
46.284
+1.232
2.73%
jan 1, 1978
47.516
+1.232
2.66%
jan 1, 1979
47.728
+0.212
0.45%
jan 1, 1980
47.94
+0.212
0.44%
jan 1, 1981
48.153
+0.212
0.44%
jan 1, 1982
48.365
+0.212
0.44%
jan 1, 1983
48.577
+0.212
0.44%
jan 1, 1984
49.065
+0.488
1.0%
jan 1, 1985
49.553
+0.488
0.99%
jan 1, 1986
50.041
+0.488
0.98%
jan 1, 1987
50.529
+0.488
0.98%
jan 1, 1988
51.017
+0.488
0.97%
jan 1, 1989
49.886
-1.131
-2.22%
jan 1, 1990
48.755
-1.131
-2.27%
jan 1, 1991
47.623
-1.131
-2.32%
jan 1, 1992
46.492
-1.131
-2.38%
jan 1, 1993
45.361
-1.131
-2.43%
jan 1, 1994
41.729
-3.632
-8.01%
jan 1, 1995
38.096
-3.632
-8.7%
jan 1, 1996
34.464
-3.632
-9.53%
jan 1, 1997
30.831
-3.632
-10.54%
jan 1, 1998
27.199
-3.632
-11.78%
jan 1, 1999
25.895
-1.304
-4.79%
jan 1, 2000
24.591
-1.304
-5.03%
jan 1, 2001
23.288
-1.304
-5.3%
jan 1, 2002
21.984
-1.304
-5.6%
jan 1, 2003
20.68
-1.304
-5.93%
jan 1, 2004
20.678
-0.002
-0.01%
jan 1, 2005
20.676
-0.002
-0.01%
jan 1, 2006
20.673
-0.002
-0.01%
jan 1, 2007
20.671
-0.002
-0.01%
jan 1, 2008
20.669
-0.002
-0.01%
jan 1, 2009
20.802
+0.133
0.65%
jan 1, 2010
20.936
+0.133
0.64%
jan 1, 2011
21.069
+0.133
0.64%
jan 1, 2012
21.203
+0.133
0.63%
jan 1, 2013
21.336
+0.133
0.63%
jan 1, 2014
20.871
-0.465
-2.18%
jan 1, 2015
20.405
-0.465
-2.23%
jan 1, 2016
19.94
-0.465
-2.28%
Ranking of countries by current statistics by years


Comments: