29
/
en
AIzaSyAYiBZKx7MnpbEhh9jyipgxe19OcubqV5w
April 1, 2024
135175
Gabon
GAB
true
2
1
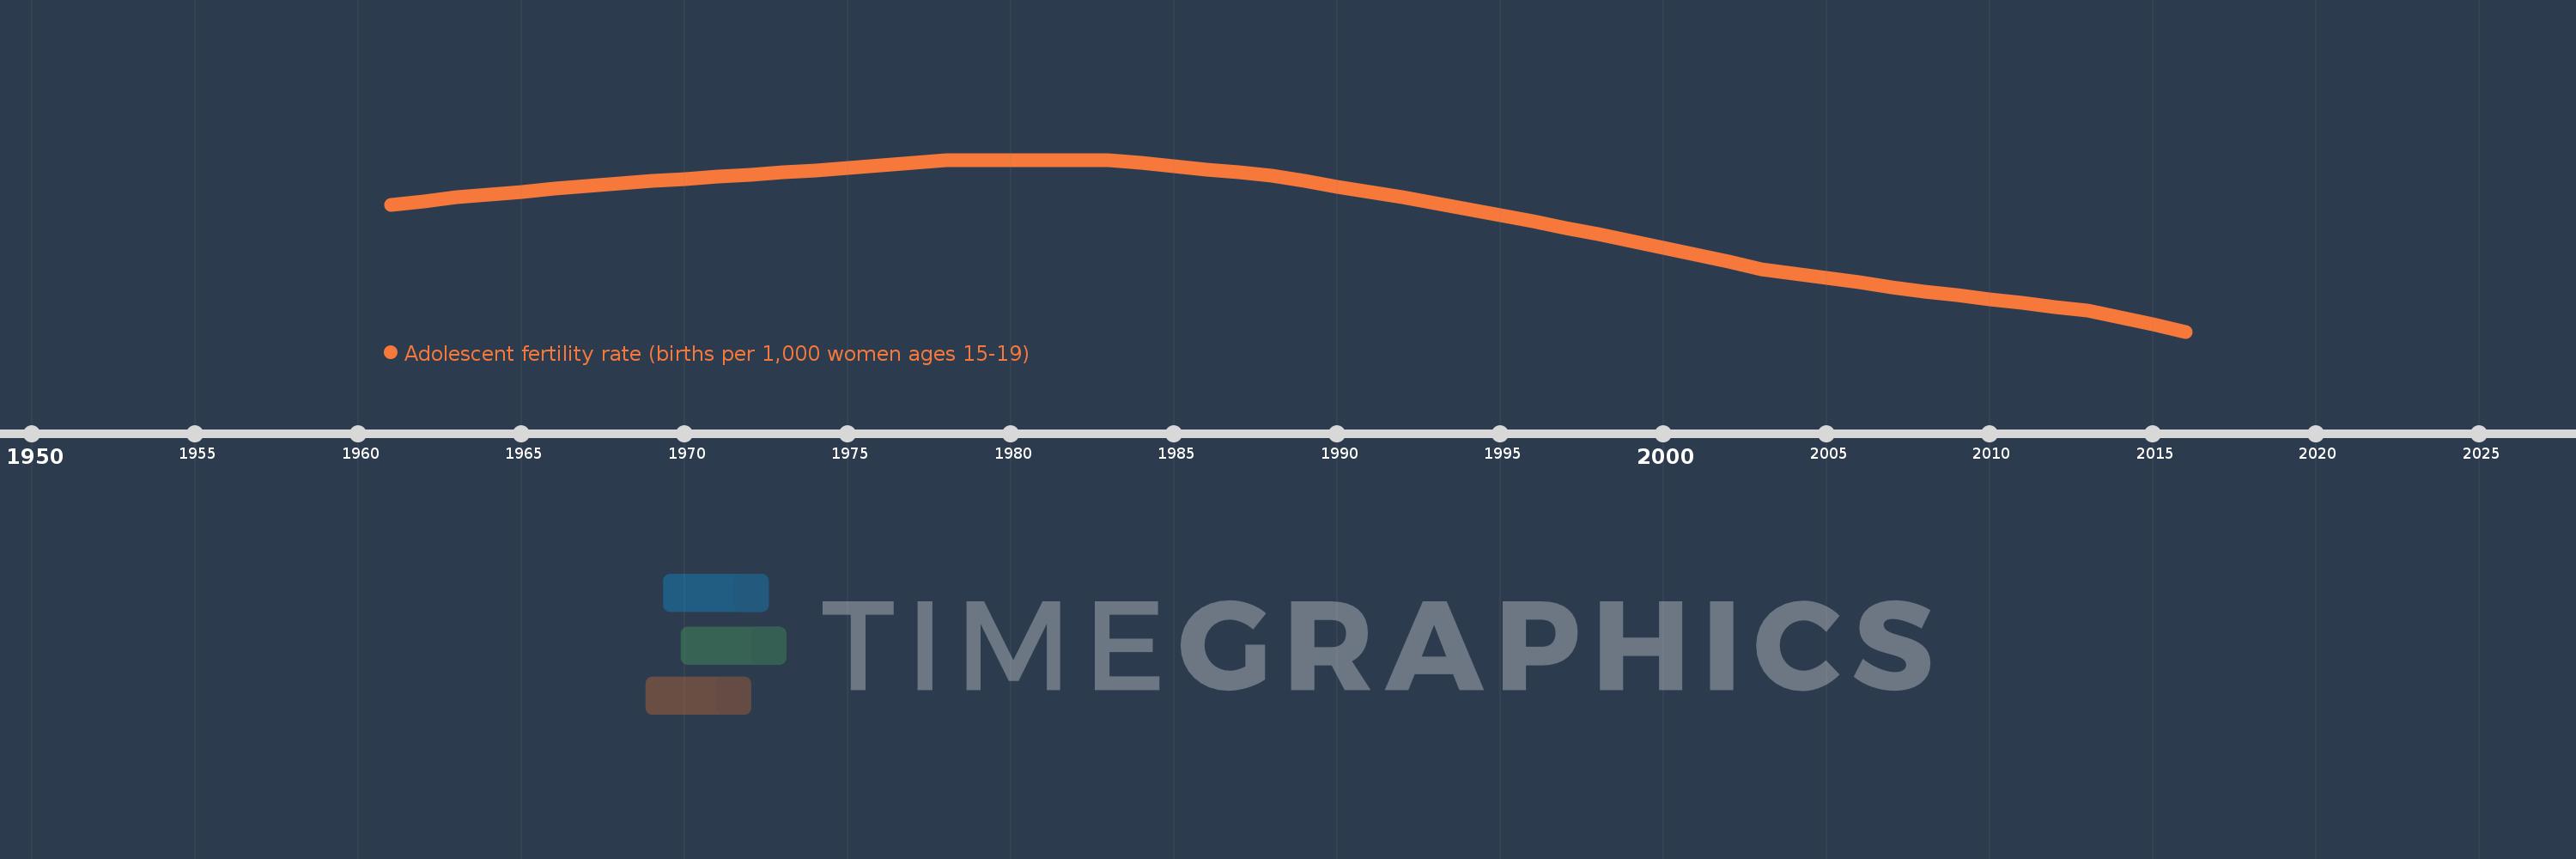
Adolescent fertility rate (births per 1,000 women ages 15-19)
2016,2015,2014,2013,2012,2011,2010,2009,2008,2007,2006,2005,2004,2003,2002,2001,2000,1999,1998,1997,1996,1995,1994,1993,1992,1991,1990,1989,1988,1987,1986,1985,1984,1983,1982,1981,1980,1979,1978,1977,1976,1975,1974,1973,1972,1971,1970,1969,1968,1967,1966,1965,1964,1963,1962,1961
This statistics in other country:
AfghanistanAlbaniaAlgeriaAngolaAntigua and BarbudaArab WorldArgentinaArmeniaArubaAustraliaAustriaAzerbaijanBahamas, TheBahrainBangladeshBarbadosBelarusBelgiumBelizeBeninBhutanBoliviaBosnia and HerzegovinaBotswanaBrazilBrunei DarussalamBulgariaBurkina FasoBurundiCabo VerdeCambodiaCameroonCanadaCaribbean small statesCentral African RepublicCentral Europe and the BalticsChadChannel IslandsChileChinaColombiaComorosCongo, Dem. Rep.Congo, Rep.Costa RicaCote d'IvoireCroatiaCubaCuracaoCyprusCzech RepublicDenmarkDjiboutiDominican RepublicEarly-demographic dividendEast Asia & PacificEast Asia & Pacific (excluding high income)East Asia & Pacific (IDA & IBRD countries)EcuadorEgypt, Arab Rep.El SalvadorEquatorial GuineaEritreaEstoniaEthiopiaEuro areaEurope & Central AsiaEurope & Central Asia (excluding high income)Europe & Central Asia (IDA & IBRD countries)European UnionFijiFinlandFragile and conflict affected situationsFranceFrench PolynesiaGabonGambia, TheGeorgiaGermanyGhanaGreeceGrenadaGuamGuatemalaGuineaGuinea-BissauGuyanaHaitiHeavily indebted poor countries (HIPC)High incomeHondurasHong Kong SAR, ChinaHungaryIBRD onlyIcelandIDA & IBRD totalIDA blendIDA onlyIDA totalIndiaIndonesiaIran, Islamic Rep.IraqIrelandIsraelItalyJamaicaJapanJordanKazakhstanKenyaKiribatiKorea, Dem. People’s Rep.Korea, Rep.KuwaitKyrgyz RepublicLao PDRLate-demographic dividendLatin America & Caribbean Latin America & Caribbean (excluding high income)Latin America & the Caribbean (IDA & IBRD countries)LatviaLeast developed countries: UN classificationLebanonLesothoLiberiaLibyaLithuaniaLow & middle incomeLow incomeLower middle incomeLuxembourgMacao SAR, ChinaMacedonia, FYRMadagascarMalawiMalaysiaMaldivesMaliMaltaMauritaniaMauritiusMexicoMicronesia, Fed. Sts.Middle East & North AfricaMiddle East & North Africa (excluding high income)Middle East & North Africa (IDA & IBRD countries)Middle incomeMoldovaMongoliaMontenegroMoroccoMozambiqueMyanmarNamibiaNepalNetherlandsNew CaledoniaNew ZealandNicaraguaNigerNigeriaNorth AmericaNorwayOECD membersOmanOther small statesPacific island small statesPakistanPanamaPapua New GuineaParaguayPeruPhilippinesPolandPortugalPost-demographic dividendPre-demographic dividendPuerto RicoQatarRomaniaRussian FederationRwandaSamoaSao Tome and PrincipeSaudi ArabiaSenegalSerbiaSeychellesSierra LeoneSingaporeSlovak RepublicSloveniaSmall statesSolomon IslandsSomaliaSouth AfricaSouth AsiaSouth Asia (IDA & IBRD)South SudanSpainSri LankaSt. LuciaSt. Vincent and the GrenadinesSub-Saharan Africa Sub-Saharan Africa (excluding high income)Sub-Saharan Africa (IDA & IBRD countries)SudanSurinameSwazilandSwedenSwitzerlandSyrian Arab RepublicTajikistanTanzaniaThailandTimor-LesteTogoTongaTrinidad and TobagoTunisiaTurkeyTurkmenistanUgandaUkraineUnited Arab EmiratesUnited KingdomUnited StatesUpper middle incomeUruguayUzbekistanVanuatuVenezuela, RBVietnamVirgin Islands (U.S.)West Bank and GazaWorldYemen, Rep.ZambiaZimbabwe Timeline:
This timeline shows a graph from 1961 to 2016 of Gabon. No data until 1960. Number of actual observations by date: 56.
Source name:
World Development Indicators
Source organization:
United Nations Population Division, World Population Prospects.
Categories, topics:
Health, Gender, Social Development
Last updated:
apr 23, 2017
Indicators value changes by year
Minimum:
97.692
jan 1, 2016
Maximum:
209.514
jan 1, 1983
At the date of observation
Value
Absolute change
Change from previous value
jan 1, 1961
180.314
+180.314
0.0%
jan 1, 1962
182.65
+2.335
1.3%
jan 1, 1963
184.985
+2.335
1.28%
jan 1, 1964
186.862
+1.877
1.01%
jan 1, 1965
188.739
+1.877
1.0%
jan 1, 1966
190.616
+1.877
0.99%
jan 1, 1967
192.493
+1.877
0.98%
jan 1, 1968
194.37
+1.877
0.98%
jan 1, 1969
195.727
+1.357
0.7%
jan 1, 1970
197.083
+1.357
0.69%
jan 1, 1971
198.44
+1.357
0.69%
jan 1, 1972
199.796
+1.357
0.68%
jan 1, 1973
201.153
+1.357
0.68%
jan 1, 1974
202.765
+1.612
0.8%
jan 1, 1975
204.378
+1.612
0.8%
jan 1, 1976
205.99
+1.612
0.79%
jan 1, 1977
207.603
+1.612
0.78%
jan 1, 1978
209.215
+1.612
0.78%
jan 1, 1979
209.275
+0.06
0.03%
jan 1, 1980
209.335
+0.06
0.03%
jan 1, 1981
209.394
+0.06
0.03%
jan 1, 1982
209.454
+0.06
0.03%
jan 1, 1983
209.514
+0.06
0.03%
jan 1, 1984
207.426
-2.088
-1.0%
jan 1, 1985
205.338
-2.088
-1.01%
jan 1, 1986
203.251
-2.088
-1.02%
jan 1, 1987
201.163
-2.088
-1.03%
jan 1, 1988
199.075
-2.088
-1.04%
jan 1, 1989
195.539
-3.536
-1.78%
jan 1, 1990
192.002
-3.536
-1.81%
jan 1, 1991
188.466
-3.536
-1.84%
jan 1, 1992
184.929
-3.536
-1.88%
jan 1, 1993
181.393
-3.536
-1.91%
jan 1, 1994
177.373
-4.02
-2.22%
jan 1, 1995
173.352
-4.02
-2.27%
jan 1, 1996
169.332
-4.02
-2.32%
jan 1, 1997
165.311
-4.02
-2.37%
jan 1, 1998
161.291
-4.02
-2.43%
jan 1, 1999
156.725
-4.566
-2.83%
jan 1, 2000
152.158
-4.566
-2.91%
jan 1, 2001
147.592
-4.566
-3.0%
jan 1, 2002
143.025
-4.566
-3.09%
jan 1, 2003
138.459
-4.566
-3.19%
jan 1, 2004
135.516
-2.943
-2.13%
jan 1, 2005
132.573
-2.943
-2.17%
jan 1, 2006
129.631
-2.943
-2.22%
jan 1, 2007
126.688
-2.943
-2.27%
jan 1, 2008
123.745
-2.943
-2.32%
jan 1, 2009
121.239
-2.506
-2.02%
jan 1, 2010
118.733
-2.506
-2.07%
jan 1, 2011
116.228
-2.506
-2.11%
jan 1, 2012
113.722
-2.506
-2.16%
jan 1, 2013
111.216
-2.506
-2.2%
jan 1, 2014
106.708
-4.508
-4.05%
jan 1, 2015
102.2
-4.508
-4.22%
jan 1, 2016
97.692
-4.508
-4.41%
Ranking of countries by current statistics by years


Comments: