29
/
en
AIzaSyAYiBZKx7MnpbEhh9jyipgxe19OcubqV5w
April 1, 2024
60532
Sub-Saharan Africa (IDA & IBRD countries)
TSS
false
2
1
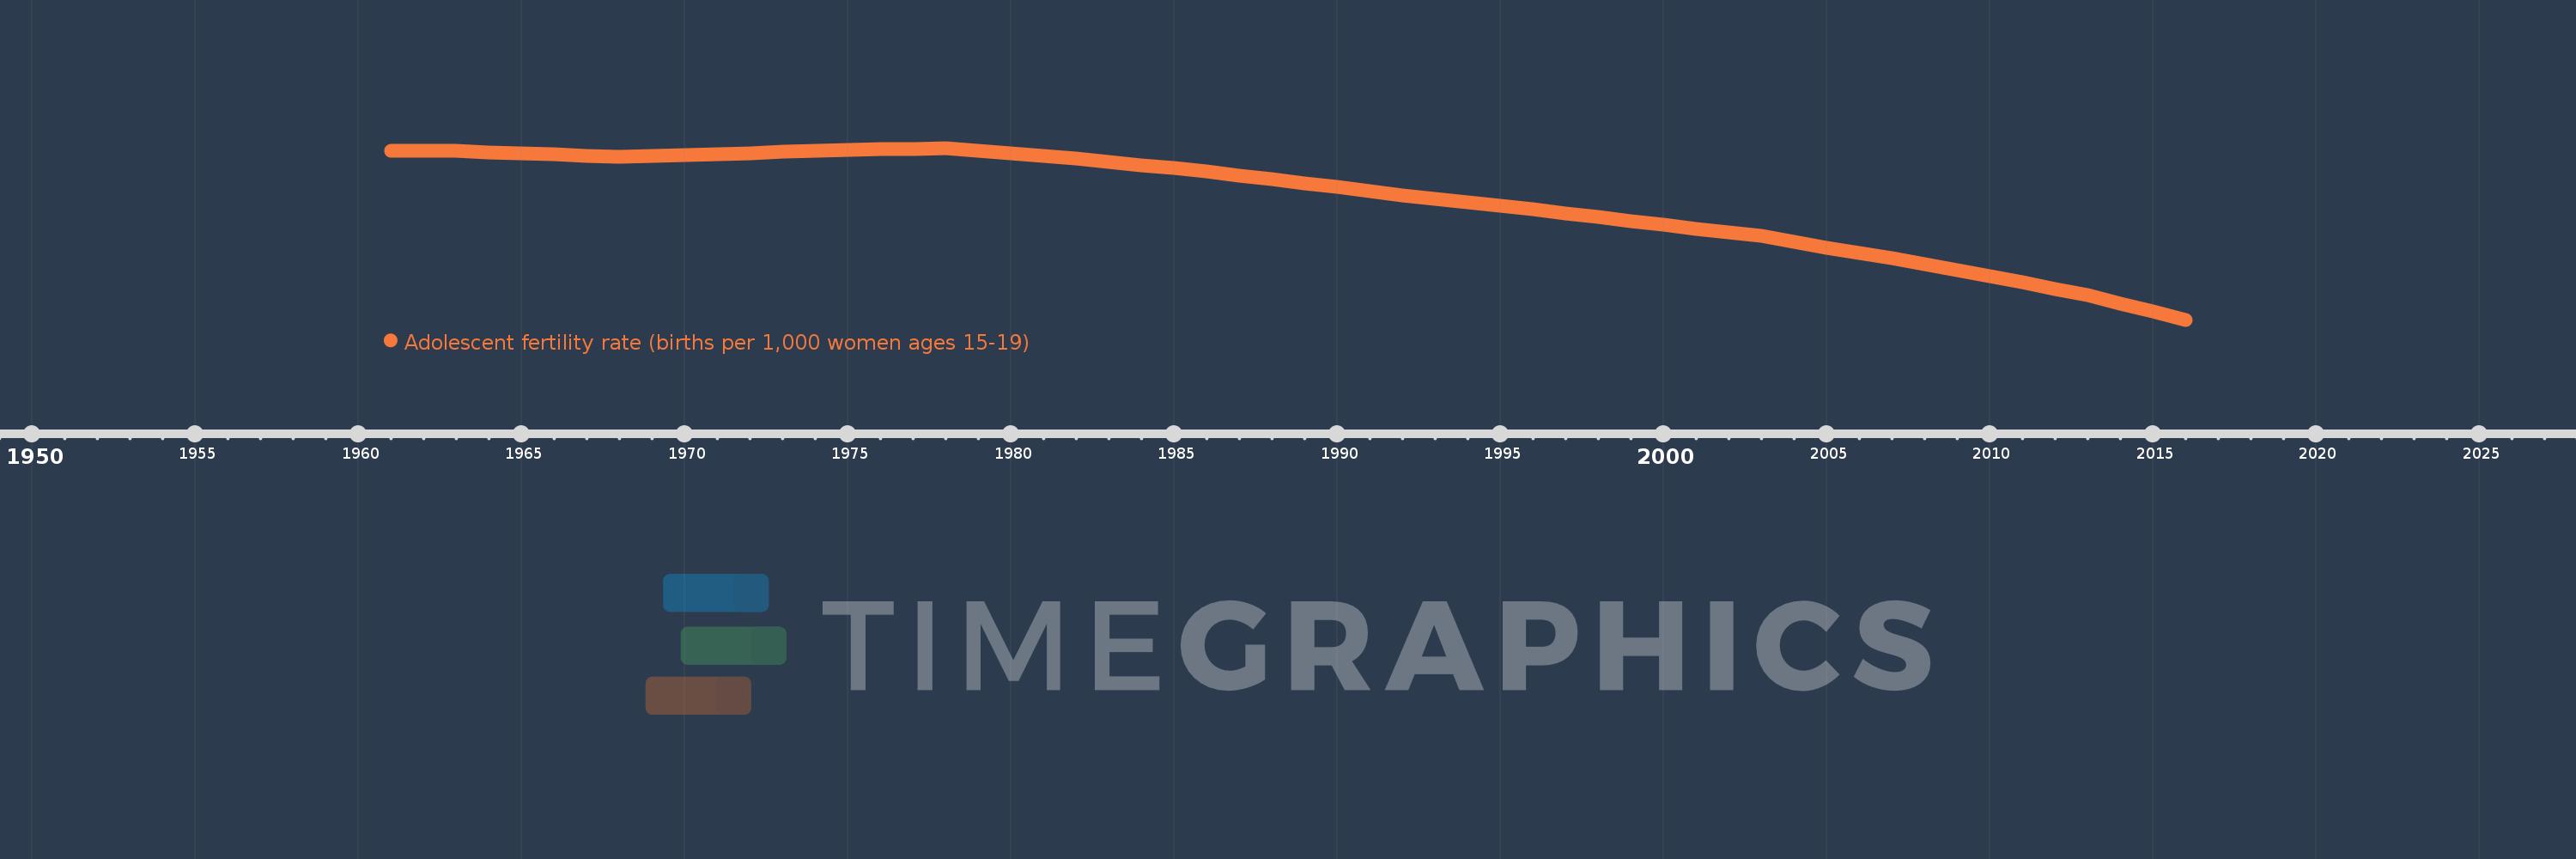
Adolescent fertility rate (births per 1,000 women ages 15-19)
2016,2015,2014,2013,2012,2011,2010,2009,2008,2007,2006,2005,2004,2003,2002,2001,2000,1999,1998,1997,1996,1995,1994,1993,1992,1991,1990,1989,1988,1987,1986,1985,1984,1983,1982,1981,1980,1979,1978,1977,1976,1975,1974,1973,1972,1971,1970,1969,1968,1967,1966,1965,1964,1963,1962,1961
This statistics in other country:
AfghanistanAlbaniaAlgeriaAngolaAntigua and BarbudaArab WorldArgentinaArmeniaArubaAustraliaAustriaAzerbaijanBahamas, TheBahrainBangladeshBarbadosBelarusBelgiumBelizeBeninBhutanBoliviaBosnia and HerzegovinaBotswanaBrazilBrunei DarussalamBulgariaBurkina FasoBurundiCabo VerdeCambodiaCameroonCanadaCaribbean small statesCentral African RepublicCentral Europe and the BalticsChadChannel IslandsChileChinaColombiaComorosCongo, Dem. Rep.Congo, Rep.Costa RicaCote d'IvoireCroatiaCubaCuracaoCyprusCzech RepublicDenmarkDjiboutiDominican RepublicEarly-demographic dividendEast Asia & PacificEast Asia & Pacific (excluding high income)East Asia & Pacific (IDA & IBRD countries)EcuadorEgypt, Arab Rep.El SalvadorEquatorial GuineaEritreaEstoniaEthiopiaEuro areaEurope & Central AsiaEurope & Central Asia (excluding high income)Europe & Central Asia (IDA & IBRD countries)European UnionFijiFinlandFragile and conflict affected situationsFranceFrench PolynesiaGabonGambia, TheGeorgiaGermanyGhanaGreeceGrenadaGuamGuatemalaGuineaGuinea-BissauGuyanaHaitiHeavily indebted poor countries (HIPC)High incomeHondurasHong Kong SAR, ChinaHungaryIBRD onlyIcelandIDA & IBRD totalIDA blendIDA onlyIDA totalIndiaIndonesiaIran, Islamic Rep.IraqIrelandIsraelItalyJamaicaJapanJordanKazakhstanKenyaKiribatiKorea, Dem. People’s Rep.Korea, Rep.KuwaitKyrgyz RepublicLao PDRLate-demographic dividendLatin America & Caribbean Latin America & Caribbean (excluding high income)Latin America & the Caribbean (IDA & IBRD countries)LatviaLeast developed countries: UN classificationLebanonLesothoLiberiaLibyaLithuaniaLow & middle incomeLow incomeLower middle incomeLuxembourgMacao SAR, ChinaMacedonia, FYRMadagascarMalawiMalaysiaMaldivesMaliMaltaMauritaniaMauritiusMexicoMicronesia, Fed. Sts.Middle East & North AfricaMiddle East & North Africa (excluding high income)Middle East & North Africa (IDA & IBRD countries)Middle incomeMoldovaMongoliaMontenegroMoroccoMozambiqueMyanmarNamibiaNepalNetherlandsNew CaledoniaNew ZealandNicaraguaNigerNigeriaNorth AmericaNorwayOECD membersOmanOther small statesPacific island small statesPakistanPanamaPapua New GuineaParaguayPeruPhilippinesPolandPortugalPost-demographic dividendPre-demographic dividendPuerto RicoQatarRomaniaRussian FederationRwandaSamoaSao Tome and PrincipeSaudi ArabiaSenegalSerbiaSeychellesSierra LeoneSingaporeSlovak RepublicSloveniaSmall statesSolomon IslandsSomaliaSouth AfricaSouth AsiaSouth Asia (IDA & IBRD)South SudanSpainSri LankaSt. LuciaSt. Vincent and the GrenadinesSub-Saharan Africa Sub-Saharan Africa (excluding high income)Sub-Saharan Africa (IDA & IBRD countries)SudanSurinameSwazilandSwedenSwitzerlandSyrian Arab RepublicTajikistanTanzaniaThailandTimor-LesteTogoTongaTrinidad and TobagoTunisiaTurkeyTurkmenistanUgandaUkraineUnited Arab EmiratesUnited KingdomUnited StatesUpper middle incomeUruguayUzbekistanVanuatuVenezuela, RBVietnamVirgin Islands (U.S.)West Bank and GazaWorldYemen, Rep.ZambiaZimbabwe Timeline:
This timeline shows a graph from 1961 to 2016 of Sub-Saharan Africa (IDA & IBRD countries). No data until 1960. Number of actual observations by date: 56.
Source name:
World Development Indicators
Source organization:
United Nations Population Division, World Population Prospects.
Categories, topics:
Health, Gender, Social Development
Last updated:
apr 23, 2017
Indicators value changes by year
Minimum:
100.445
jan 1, 2016
Maximum:
153.838
jan 1, 1978
At the date of observation
Value
Absolute change
Change from previous value
jan 1, 1961
152.964
+152.964
0.0%
jan 1, 1962
152.898
-0.066
-0.04%
jan 1, 1963
152.836
-0.061
-0.04%
jan 1, 1964
152.46
-0.377
-0.25%
jan 1, 1965
152.121
-0.338
-0.22%
jan 1, 1966
151.817
-0.304
-0.2%
jan 1, 1967
151.472
-0.345
-0.23%
jan 1, 1968
151.166
-0.306
-0.2%
jan 1, 1969
151.432
+0.265
0.18%
jan 1, 1970
151.712
+0.281
0.19%
jan 1, 1971
151.998
+0.286
0.19%
jan 1, 1972
152.278
+0.28
0.18%
jan 1, 1973
152.572
+0.293
0.19%
jan 1, 1974
152.841
+0.27
0.18%
jan 1, 1975
153.107
+0.266
0.17%
jan 1, 1976
153.366
+0.258
0.17%
jan 1, 1977
153.59
+0.224
0.15%
jan 1, 1978
153.838
+0.248
0.16%
jan 1, 1979
153.0
-0.838
-0.54%
jan 1, 1980
152.174
-0.826
-0.54%
jan 1, 1981
151.35
-0.824
-0.54%
jan 1, 1982
150.465
-0.885
-0.58%
jan 1, 1983
149.59
-0.875
-0.58%
jan 1, 1984
148.547
-1.044
-0.7%
jan 1, 1985
147.495
-1.052
-0.71%
jan 1, 1986
146.434
-1.061
-0.72%
jan 1, 1987
145.326
-1.108
-0.76%
jan 1, 1988
144.224
-1.102
-0.76%
jan 1, 1989
142.934
-1.29
-0.89%
jan 1, 1990
141.662
-1.272
-0.89%
jan 1, 1991
140.414
-1.248
-0.88%
jan 1, 1992
139.16
-1.254
-0.89%
jan 1, 1993
137.925
-1.235
-0.89%
jan 1, 1994
136.889
-1.035
-0.75%
jan 1, 1995
135.822
-1.068
-0.78%
jan 1, 1996
134.71
-1.112
-0.82%
jan 1, 1997
133.54
-1.169
-0.87%
jan 1, 1998
132.325
-1.215
-0.91%
jan 1, 1999
131.097
-1.228
-0.93%
jan 1, 2000
129.872
-1.225
-0.93%
jan 1, 2001
128.677
-1.195
-0.92%
jan 1, 2002
127.517
-1.16
-0.9%
jan 1, 2003
126.441
-1.076
-0.84%
jan 1, 2004
124.66
-1.781
-1.41%
jan 1, 2005
122.917
-1.742
-1.4%
jan 1, 2006
121.202
-1.715
-1.4%
jan 1, 2007
119.482
-1.721
-1.42%
jan 1, 2008
117.785
-1.697
-1.42%
jan 1, 2009
115.895
-1.89
-1.6%
jan 1, 2010
113.993
-1.902
-1.64%
jan 1, 2011
112.069
-1.924
-1.69%
jan 1, 2012
110.099
-1.97
-1.76%
jan 1, 2013
108.115
-1.983
-1.8%
jan 1, 2014
105.558
-2.557
-2.37%
jan 1, 2015
103.0
-2.558
-2.42%
jan 1, 2016
100.445
-2.555
-2.48%
Ranking of countries by current statistics by years


Comments: