29
/
en
AIzaSyAYiBZKx7MnpbEhh9jyipgxe19OcubqV5w
April 1, 2024
285485
Zambia
ZMB
true
2
1
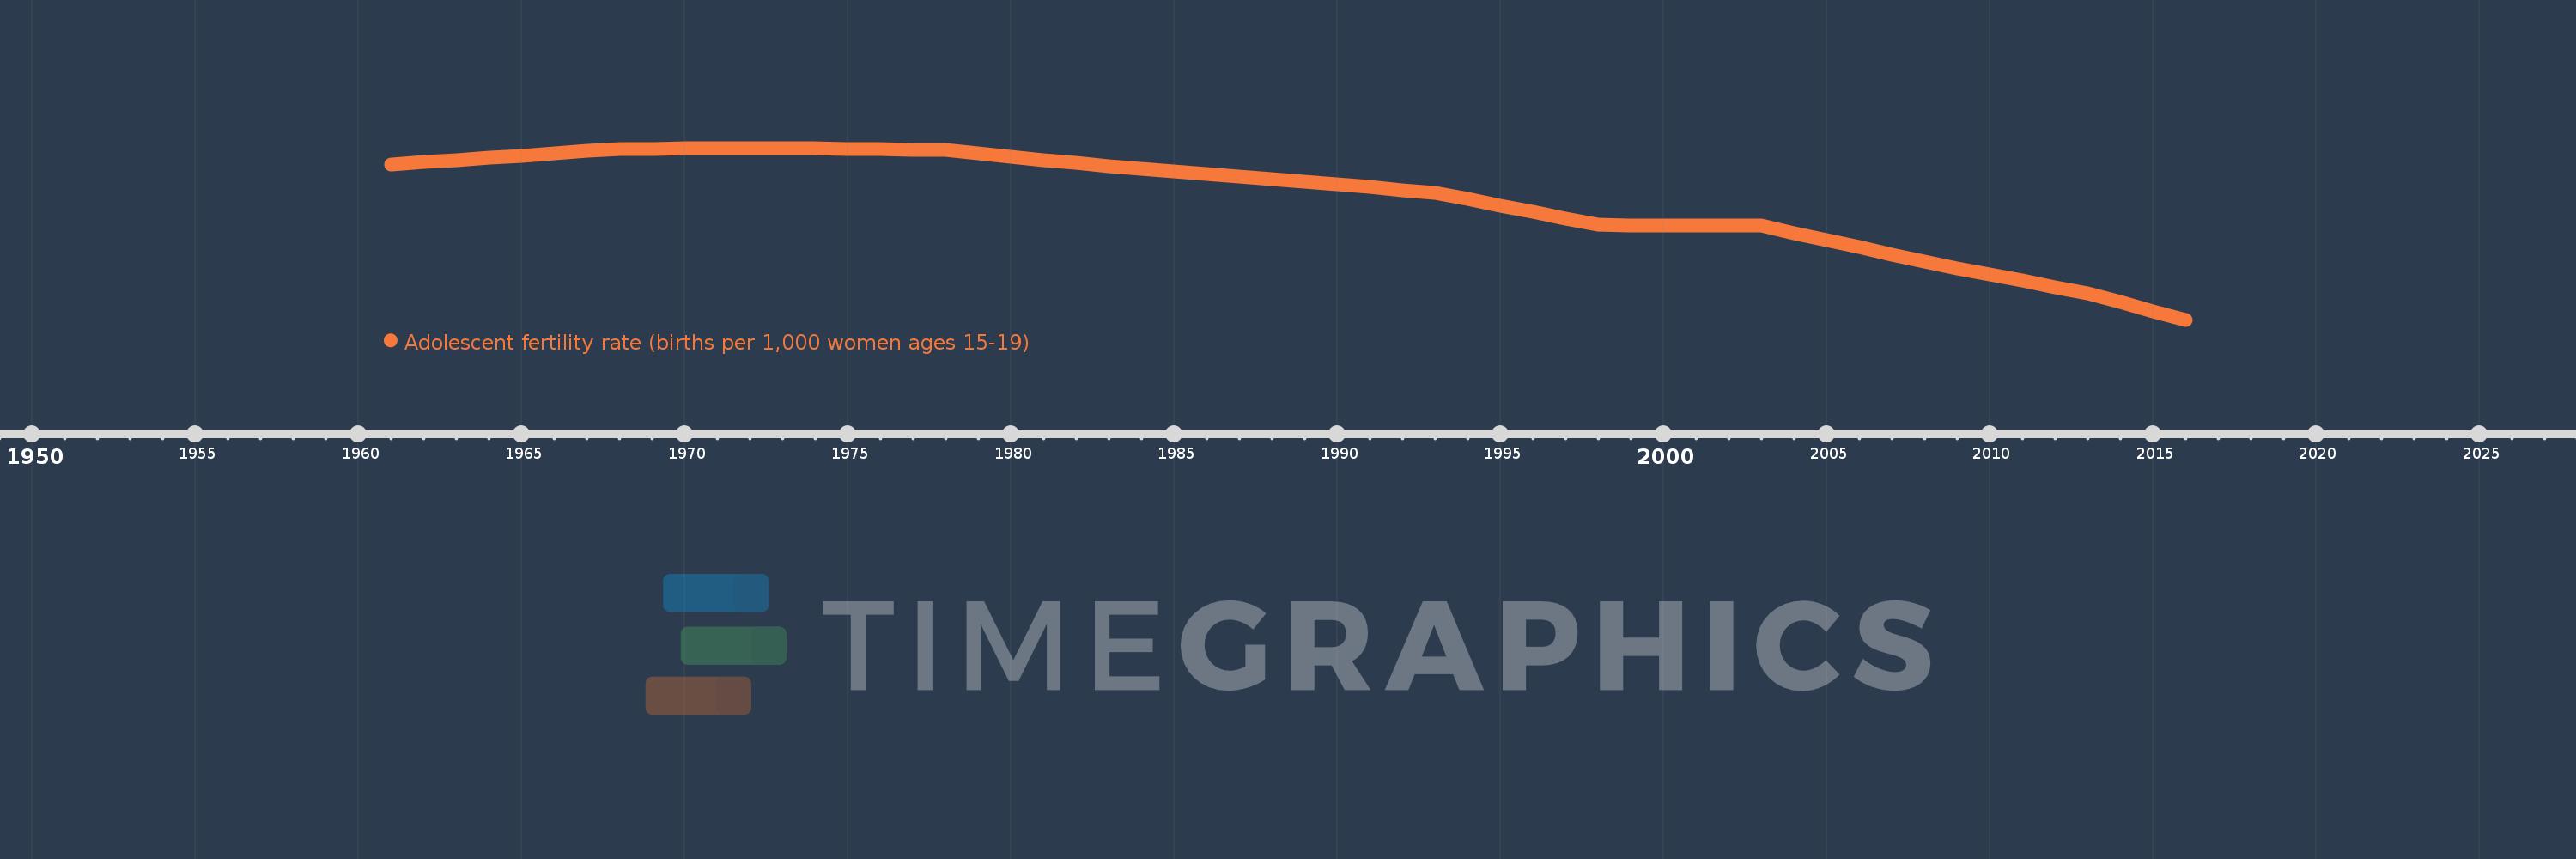
Adolescent fertility rate (births per 1,000 women ages 15-19)
2016,2015,2014,2013,2012,2011,2010,2009,2008,2007,2006,2005,2004,2003,2002,2001,2000,1999,1998,1997,1996,1995,1994,1993,1992,1991,1990,1989,1988,1987,1986,1985,1984,1983,1982,1981,1980,1979,1978,1977,1976,1975,1974,1973,1972,1971,1970,1969,1968,1967,1966,1965,1964,1963,1962,1961
This statistics in other country:
AfghanistanAlbaniaAlgeriaAngolaAntigua and BarbudaArab WorldArgentinaArmeniaArubaAustraliaAustriaAzerbaijanBahamas, TheBahrainBangladeshBarbadosBelarusBelgiumBelizeBeninBhutanBoliviaBosnia and HerzegovinaBotswanaBrazilBrunei DarussalamBulgariaBurkina FasoBurundiCabo VerdeCambodiaCameroonCanadaCaribbean small statesCentral African RepublicCentral Europe and the BalticsChadChannel IslandsChileChinaColombiaComorosCongo, Dem. Rep.Congo, Rep.Costa RicaCote d'IvoireCroatiaCubaCuracaoCyprusCzech RepublicDenmarkDjiboutiDominican RepublicEarly-demographic dividendEast Asia & PacificEast Asia & Pacific (excluding high income)East Asia & Pacific (IDA & IBRD countries)EcuadorEgypt, Arab Rep.El SalvadorEquatorial GuineaEritreaEstoniaEthiopiaEuro areaEurope & Central AsiaEurope & Central Asia (excluding high income)Europe & Central Asia (IDA & IBRD countries)European UnionFijiFinlandFragile and conflict affected situationsFranceFrench PolynesiaGabonGambia, TheGeorgiaGermanyGhanaGreeceGrenadaGuamGuatemalaGuineaGuinea-BissauGuyanaHaitiHeavily indebted poor countries (HIPC)High incomeHondurasHong Kong SAR, ChinaHungaryIBRD onlyIcelandIDA & IBRD totalIDA blendIDA onlyIDA totalIndiaIndonesiaIran, Islamic Rep.IraqIrelandIsraelItalyJamaicaJapanJordanKazakhstanKenyaKiribatiKorea, Dem. People’s Rep.Korea, Rep.KuwaitKyrgyz RepublicLao PDRLate-demographic dividendLatin America & Caribbean Latin America & Caribbean (excluding high income)Latin America & the Caribbean (IDA & IBRD countries)LatviaLeast developed countries: UN classificationLebanonLesothoLiberiaLibyaLithuaniaLow & middle incomeLow incomeLower middle incomeLuxembourgMacao SAR, ChinaMacedonia, FYRMadagascarMalawiMalaysiaMaldivesMaliMaltaMauritaniaMauritiusMexicoMicronesia, Fed. Sts.Middle East & North AfricaMiddle East & North Africa (excluding high income)Middle East & North Africa (IDA & IBRD countries)Middle incomeMoldovaMongoliaMontenegroMoroccoMozambiqueMyanmarNamibiaNepalNetherlandsNew CaledoniaNew ZealandNicaraguaNigerNigeriaNorth AmericaNorwayOECD membersOmanOther small statesPacific island small statesPakistanPanamaPapua New GuineaParaguayPeruPhilippinesPolandPortugalPost-demographic dividendPre-demographic dividendPuerto RicoQatarRomaniaRussian FederationRwandaSamoaSao Tome and PrincipeSaudi ArabiaSenegalSerbiaSeychellesSierra LeoneSingaporeSlovak RepublicSloveniaSmall statesSolomon IslandsSomaliaSouth AfricaSouth AsiaSouth Asia (IDA & IBRD)South SudanSpainSri LankaSt. LuciaSt. Vincent and the GrenadinesSub-Saharan Africa Sub-Saharan Africa (excluding high income)Sub-Saharan Africa (IDA & IBRD countries)SudanSurinameSwazilandSwedenSwitzerlandSyrian Arab RepublicTajikistanTanzaniaThailandTimor-LesteTogoTongaTrinidad and TobagoTunisiaTurkeyTurkmenistanUgandaUkraineUnited Arab EmiratesUnited KingdomUnited StatesUpper middle incomeUruguayUzbekistanVanuatuVenezuela, RBVietnamVirgin Islands (U.S.)West Bank and GazaWorldYemen, Rep.ZambiaZimbabwe Timeline:
This timeline shows a graph from 1961 to 2016 of Zambia. No data until 1960. Number of actual observations by date: 56.
Source name:
World Development Indicators
Source organization:
United Nations Population Division, World Population Prospects.
Categories, topics:
Health, Gender, Social Development
Last updated:
apr 23, 2017
Indicators value changes by year
Minimum:
87.857
jan 1, 2016
Maximum:
189.128
jan 1, 1973
At the date of observation
Value
Absolute change
Change from previous value
jan 1, 1961
179.576
+179.576
0.0%
jan 1, 1962
180.849
+1.274
0.71%
jan 1, 1963
182.123
+1.274
0.7%
jan 1, 1964
183.397
+1.274
0.7%
jan 1, 1965
184.67
+1.274
0.69%
jan 1, 1966
185.944
+1.274
0.69%
jan 1, 1967
187.217
+1.274
0.68%
jan 1, 1968
188.491
+1.274
0.68%
jan 1, 1969
188.618
+0.127
0.07%
jan 1, 1970
188.746
+0.127
0.07%
jan 1, 1971
188.873
+0.127
0.07%
jan 1, 1972
189.001
+0.127
0.07%
jan 1, 1973
189.128
+0.127
0.07%
jan 1, 1974
188.873
-0.255
-0.13%
jan 1, 1975
188.618
-0.255
-0.13%
jan 1, 1976
188.364
-0.255
-0.14%
jan 1, 1977
188.109
-0.255
-0.14%
jan 1, 1978
187.854
-0.255
-0.14%
jan 1, 1979
185.944
-1.91
-1.02%
jan 1, 1980
184.033
-1.91
-1.03%
jan 1, 1981
182.123
-1.91
-1.04%
jan 1, 1982
180.212
-1.91
-1.05%
jan 1, 1983
178.302
-1.91
-1.06%
jan 1, 1984
176.839
-1.463
-0.82%
jan 1, 1985
175.375
-1.463
-0.83%
jan 1, 1986
173.912
-1.463
-0.83%
jan 1, 1987
172.448
-1.463
-0.84%
jan 1, 1988
170.985
-1.463
-0.85%
jan 1, 1989
169.32
-1.665
-0.97%
jan 1, 1990
167.655
-1.665
-0.98%
jan 1, 1991
165.99
-1.665
-0.99%
jan 1, 1992
164.325
-1.665
-1.0%
jan 1, 1993
162.66
-1.665
-1.01%
jan 1, 1994
158.865
-3.795
-2.33%
jan 1, 1995
155.071
-3.795
-2.39%
jan 1, 1996
151.276
-3.795
-2.45%
jan 1, 1997
147.482
-3.795
-2.51%
jan 1, 1998
143.687
-3.795
-2.57%
jan 1, 1999
143.605
-0.082
-0.06%
jan 1, 2000
143.523
-0.082
-0.06%
jan 1, 2001
143.44
-0.082
-0.06%
jan 1, 2002
143.358
-0.082
-0.06%
jan 1, 2003
143.276
-0.082
-0.06%
jan 1, 2004
139.023
-4.253
-2.97%
jan 1, 2005
134.771
-4.253
-3.06%
jan 1, 2006
130.518
-4.253
-3.16%
jan 1, 2007
126.266
-4.253
-3.26%
jan 1, 2008
122.013
-4.253
-3.37%
jan 1, 2009
118.277
-3.736
-3.06%
jan 1, 2010
114.541
-3.736
-3.16%
jan 1, 2011
110.804
-3.736
-3.26%
jan 1, 2012
107.068
-3.736
-3.37%
jan 1, 2013
103.332
-3.736
-3.49%
jan 1, 2014
98.174
-5.158
-4.99%
jan 1, 2015
93.016
-5.158
-5.25%
jan 1, 2016
87.857
-5.158
-5.55%
Ranking of countries by current statistics by years


Comments: