29
/
en
AIzaSyAYiBZKx7MnpbEhh9jyipgxe19OcubqV5w
April 1, 2024
52383
OECD members
OED
false
2
1
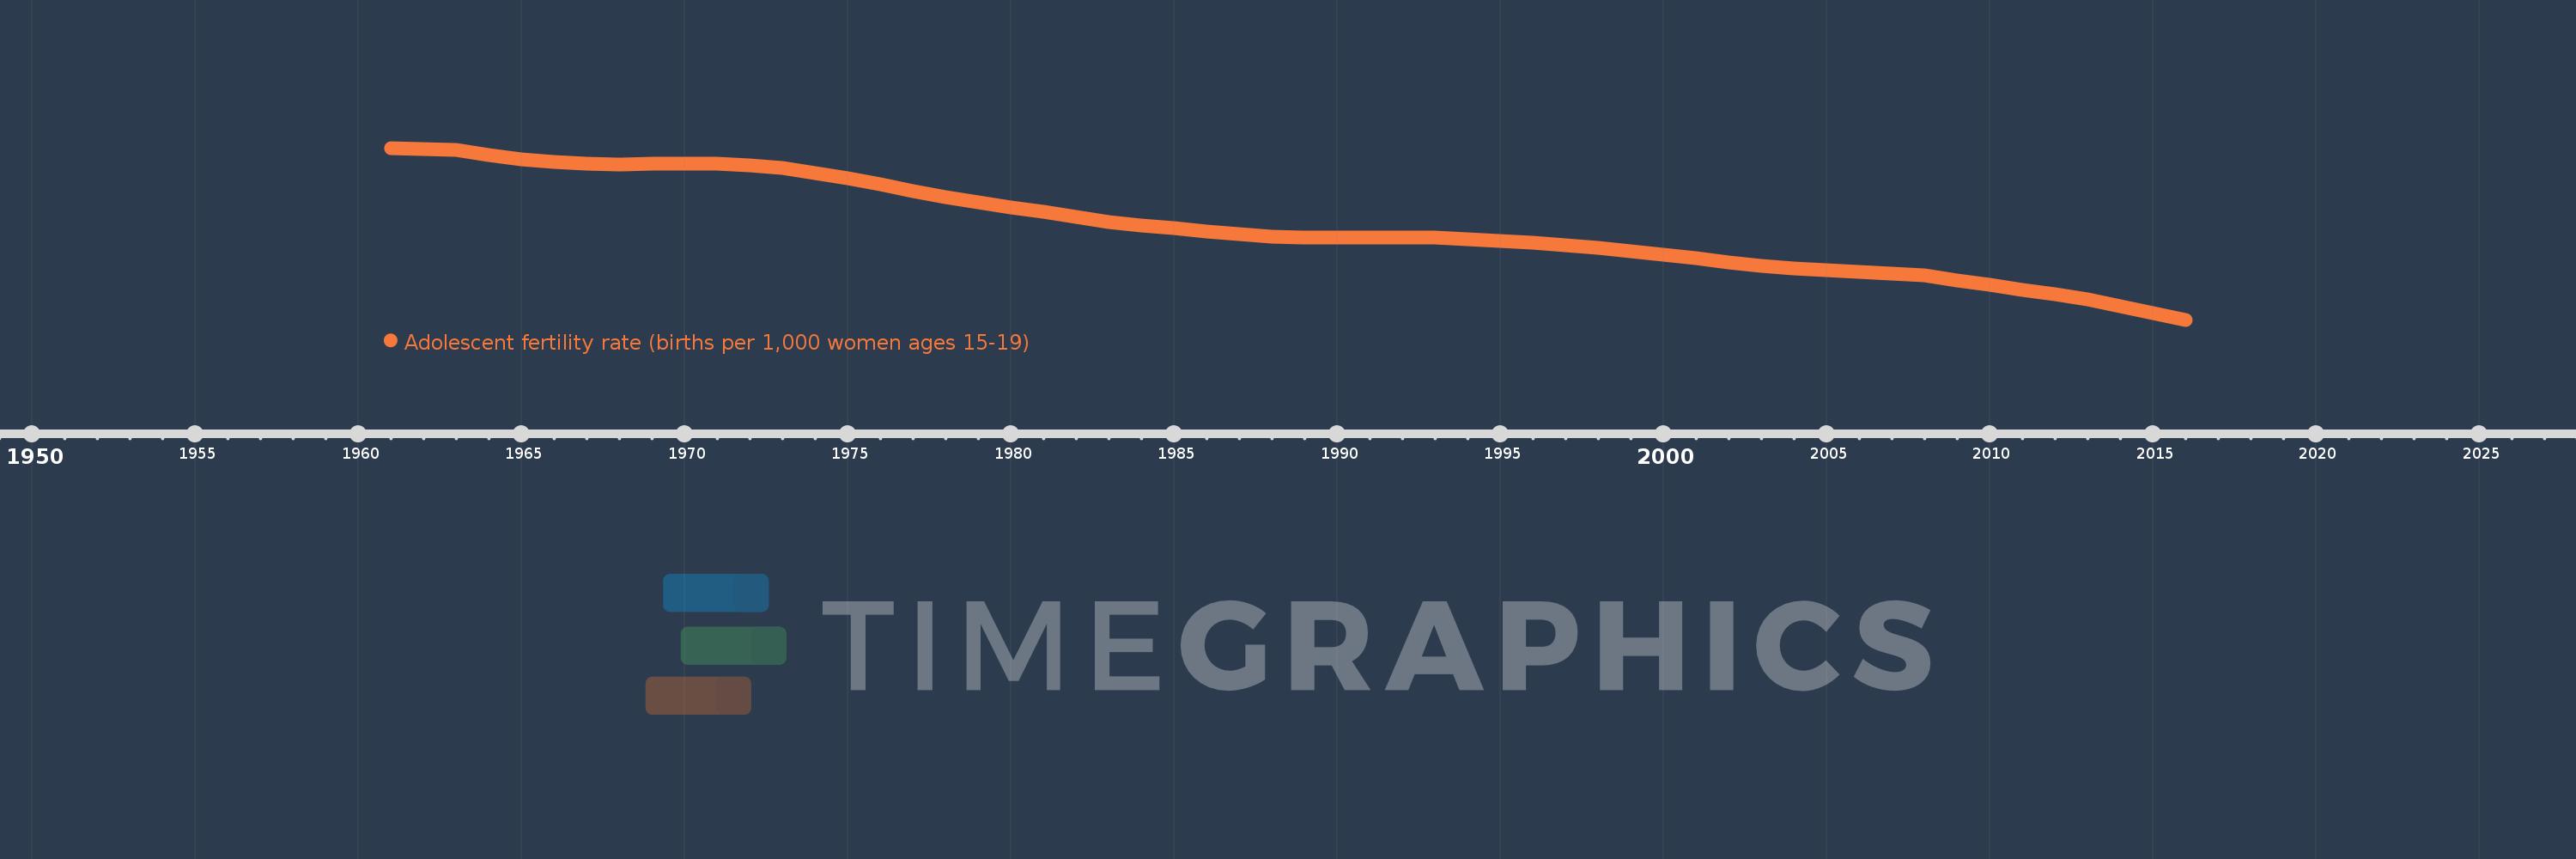
Adolescent fertility rate (births per 1,000 women ages 15-19)
2016,2015,2014,2013,2012,2011,2010,2009,2008,2007,2006,2005,2004,2003,2002,2001,2000,1999,1998,1997,1996,1995,1994,1993,1992,1991,1990,1989,1988,1987,1986,1985,1984,1983,1982,1981,1980,1979,1978,1977,1976,1975,1974,1973,1972,1971,1970,1969,1968,1967,1966,1965,1964,1963,1962,1961
This statistics in other country:
AfghanistanAlbaniaAlgeriaAngolaAntigua and BarbudaArab WorldArgentinaArmeniaArubaAustraliaAustriaAzerbaijanBahamas, TheBahrainBangladeshBarbadosBelarusBelgiumBelizeBeninBhutanBoliviaBosnia and HerzegovinaBotswanaBrazilBrunei DarussalamBulgariaBurkina FasoBurundiCabo VerdeCambodiaCameroonCanadaCaribbean small statesCentral African RepublicCentral Europe and the BalticsChadChannel IslandsChileChinaColombiaComorosCongo, Dem. Rep.Congo, Rep.Costa RicaCote d'IvoireCroatiaCubaCuracaoCyprusCzech RepublicDenmarkDjiboutiDominican RepublicEarly-demographic dividendEast Asia & PacificEast Asia & Pacific (excluding high income)East Asia & Pacific (IDA & IBRD countries)EcuadorEgypt, Arab Rep.El SalvadorEquatorial GuineaEritreaEstoniaEthiopiaEuro areaEurope & Central AsiaEurope & Central Asia (excluding high income)Europe & Central Asia (IDA & IBRD countries)European UnionFijiFinlandFragile and conflict affected situationsFranceFrench PolynesiaGabonGambia, TheGeorgiaGermanyGhanaGreeceGrenadaGuamGuatemalaGuineaGuinea-BissauGuyanaHaitiHeavily indebted poor countries (HIPC)High incomeHondurasHong Kong SAR, ChinaHungaryIBRD onlyIcelandIDA & IBRD totalIDA blendIDA onlyIDA totalIndiaIndonesiaIran, Islamic Rep.IraqIrelandIsraelItalyJamaicaJapanJordanKazakhstanKenyaKiribatiKorea, Dem. People’s Rep.Korea, Rep.KuwaitKyrgyz RepublicLao PDRLate-demographic dividendLatin America & Caribbean Latin America & Caribbean (excluding high income)Latin America & the Caribbean (IDA & IBRD countries)LatviaLeast developed countries: UN classificationLebanonLesothoLiberiaLibyaLithuaniaLow & middle incomeLow incomeLower middle incomeLuxembourgMacao SAR, ChinaMacedonia, FYRMadagascarMalawiMalaysiaMaldivesMaliMaltaMauritaniaMauritiusMexicoMicronesia, Fed. Sts.Middle East & North AfricaMiddle East & North Africa (excluding high income)Middle East & North Africa (IDA & IBRD countries)Middle incomeMoldovaMongoliaMontenegroMoroccoMozambiqueMyanmarNamibiaNepalNetherlandsNew CaledoniaNew ZealandNicaraguaNigerNigeriaNorth AmericaNorwayOECD membersOmanOther small statesPacific island small statesPakistanPanamaPapua New GuineaParaguayPeruPhilippinesPolandPortugalPost-demographic dividendPre-demographic dividendPuerto RicoQatarRomaniaRussian FederationRwandaSamoaSao Tome and PrincipeSaudi ArabiaSenegalSerbiaSeychellesSierra LeoneSingaporeSlovak RepublicSloveniaSmall statesSolomon IslandsSomaliaSouth AfricaSouth AsiaSouth Asia (IDA & IBRD)South SudanSpainSri LankaSt. LuciaSt. Vincent and the GrenadinesSub-Saharan Africa Sub-Saharan Africa (excluding high income)Sub-Saharan Africa (IDA & IBRD countries)SudanSurinameSwazilandSwedenSwitzerlandSyrian Arab RepublicTajikistanTanzaniaThailandTimor-LesteTogoTongaTrinidad and TobagoTunisiaTurkeyTurkmenistanUgandaUkraineUnited Arab EmiratesUnited KingdomUnited StatesUpper middle incomeUruguayUzbekistanVanuatuVenezuela, RBVietnamVirgin Islands (U.S.)West Bank and GazaWorldYemen, Rep.ZambiaZimbabwe Timeline:
This timeline shows a graph from 1961 to 2016 of OECD members. No data until 1960. Number of actual observations by date: 56.
Source name:
World Development Indicators
Source organization:
United Nations Population Division, World Population Prospects.
Categories, topics:
Health, Gender, Social Development
Last updated:
apr 23, 2017
Indicators value changes by year
Minimum:
21.732
jan 1, 2016
Maximum:
52.207
jan 1, 1961
At the date of observation
Value
Absolute change
Change from previous value
jan 1, 1961
52.207
+52.207
0.0%
jan 1, 1962
52.075
-0.132
-0.25%
jan 1, 1963
51.847
-0.228
-0.44%
jan 1, 1964
50.987
-0.86
-1.66%
jan 1, 1965
50.24
-0.747
-1.46%
jan 1, 1966
49.716
-0.524
-1.04%
jan 1, 1967
49.396
-0.321
-0.65%
jan 1, 1968
49.281
-0.115
-0.23%
jan 1, 1969
49.436
+0.155
0.31%
jan 1, 1970
49.454
+0.018
0.04%
jan 1, 1971
49.384
-0.07
-0.14%
jan 1, 1972
49.126
-0.258
-0.52%
jan 1, 1973
48.716
-0.41
-0.83%
jan 1, 1974
47.788
-0.928
-1.9%
jan 1, 1975
46.755
-1.033
-2.16%
jan 1, 1976
45.709
-1.047
-2.24%
jan 1, 1977
44.607
-1.101
-2.41%
jan 1, 1978
43.447
-1.16
-2.6%
jan 1, 1979
42.567
-0.881
-2.03%
jan 1, 1980
41.687
-0.88
-2.07%
jan 1, 1981
40.812
-0.875
-2.1%
jan 1, 1982
39.92
-0.892
-2.19%
jan 1, 1983
39.055
-0.865
-2.17%
jan 1, 1984
38.494
-0.561
-1.44%
jan 1, 1985
37.959
-0.535
-1.39%
jan 1, 1986
37.445
-0.514
-1.35%
jan 1, 1987
36.922
-0.524
-1.4%
jan 1, 1988
36.414
-0.507
-1.37%
jan 1, 1989
36.372
-0.042
-0.12%
jan 1, 1990
36.334
-0.037
-0.1%
jan 1, 1991
36.316
-0.018
-0.05%
jan 1, 1992
36.299
-0.017
-0.05%
jan 1, 1993
36.32
+0.021
0.06%
jan 1, 1994
36.035
-0.285
-0.79%
jan 1, 1995
35.713
-0.321
-0.89%
jan 1, 1996
35.333
-0.38
-1.06%
jan 1, 1997
34.909
-0.425
-1.2%
jan 1, 1998
34.435
-0.474
-1.36%
jan 1, 1999
33.843
-0.592
-1.72%
jan 1, 2000
33.237
-0.606
-1.79%
jan 1, 2001
32.633
-0.603
-1.82%
jan 1, 2002
31.957
-0.676
-2.07%
jan 1, 2003
31.264
-0.693
-2.17%
jan 1, 2004
30.903
-0.361
-1.15%
jan 1, 2005
30.531
-0.372
-1.2%
jan 1, 2006
30.166
-0.366
-1.2%
jan 1, 2007
29.845
-0.32
-1.06%
jan 1, 2008
29.537
-0.309
-1.03%
jan 1, 2009
28.734
-0.803
-2.72%
jan 1, 2010
27.914
-0.82
-2.85%
jan 1, 2011
27.075
-0.839
-3.01%
jan 1, 2012
26.22
-0.855
-3.16%
jan 1, 2013
25.365
-0.855
-3.26%
jan 1, 2014
24.138
-1.227
-4.84%
jan 1, 2015
22.941
-1.197
-4.96%
jan 1, 2016
21.732
-1.209
-5.27%
Ranking of countries by current statistics by years


Comments: