29
/
en
AIzaSyAYiBZKx7MnpbEhh9jyipgxe19OcubqV5w
April 1, 2024
202515
Mozambique
MOZ
true
2
1
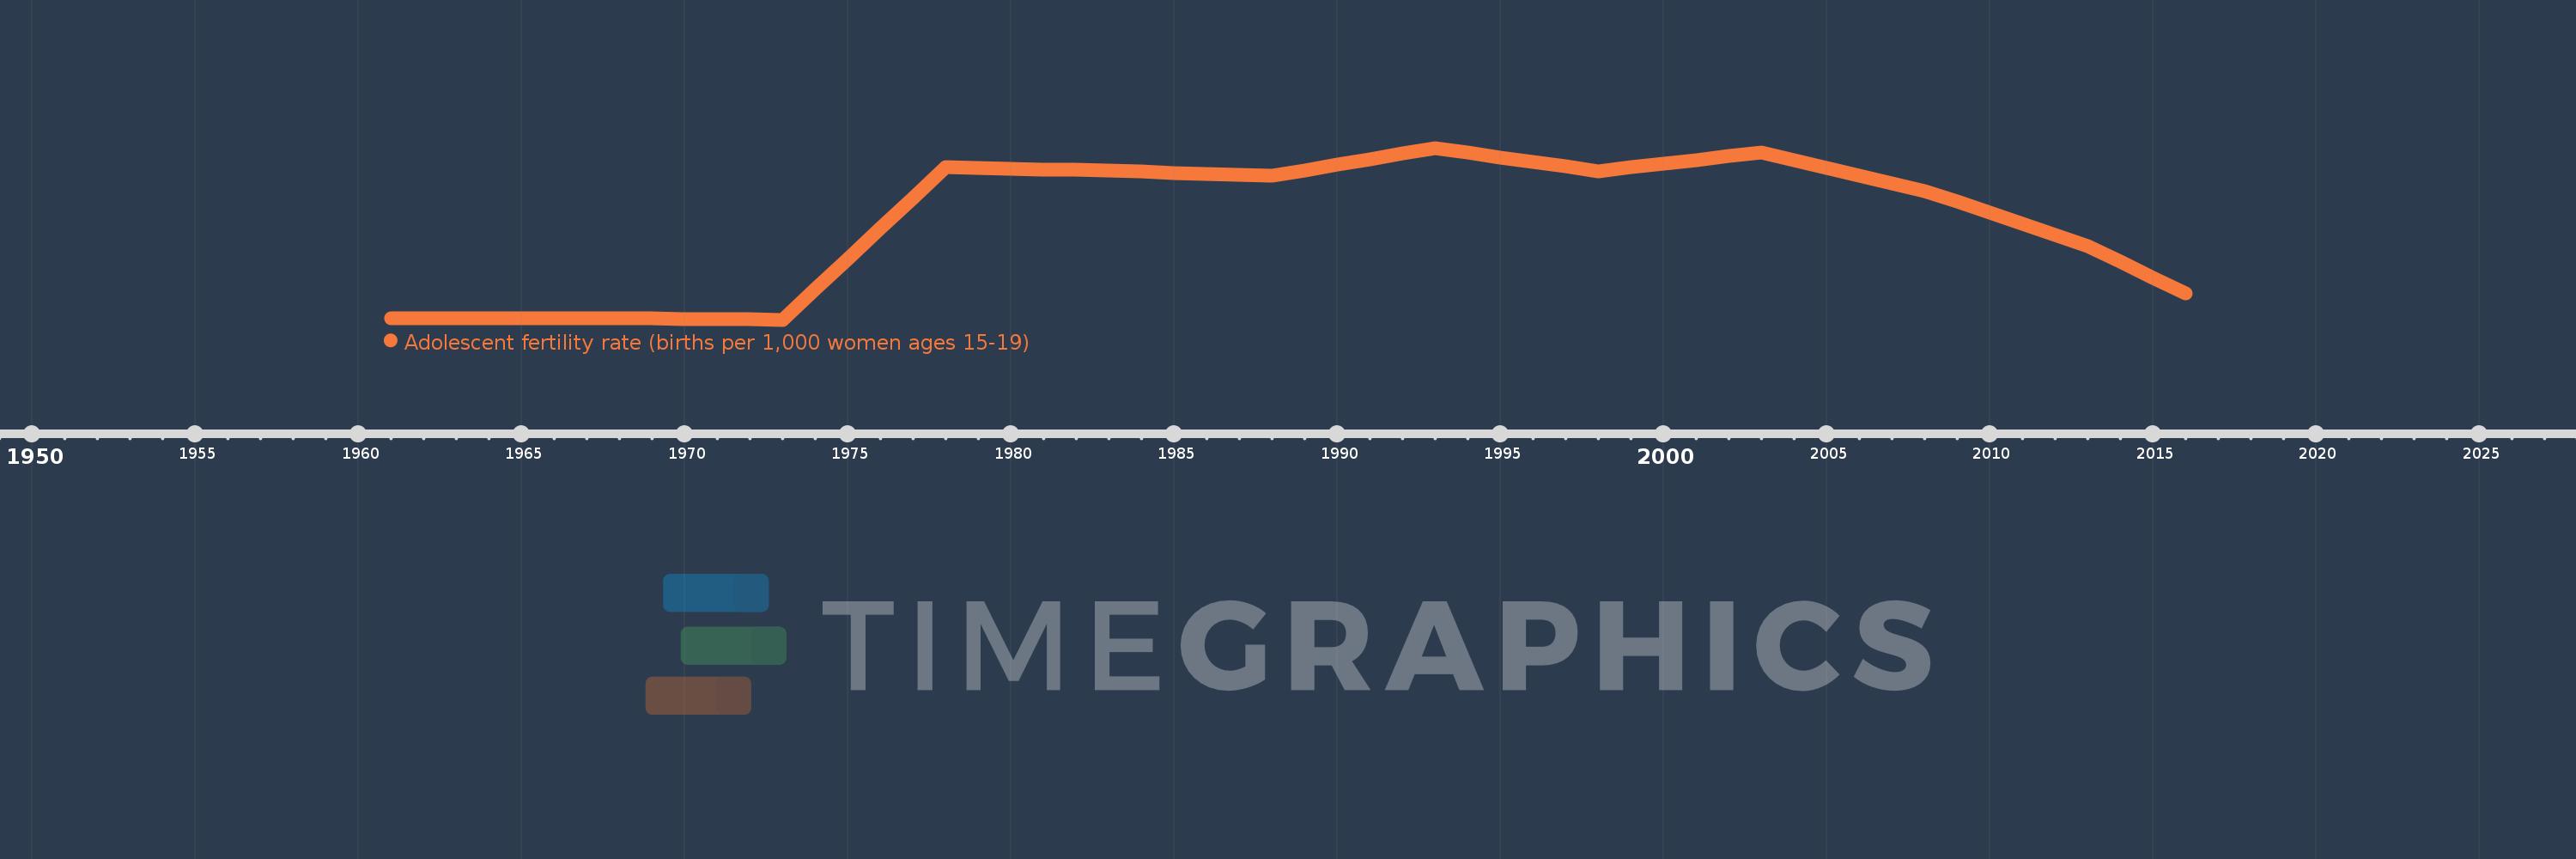
Adolescent fertility rate (births per 1,000 women ages 15-19)
2016,2015,2014,2013,2012,2011,2010,2009,2008,2007,2006,2005,2004,2003,2002,2001,2000,1999,1998,1997,1996,1995,1994,1993,1992,1991,1990,1989,1988,1987,1986,1985,1984,1983,1982,1981,1980,1979,1978,1977,1976,1975,1974,1973,1972,1971,1970,1969,1968,1967,1966,1965,1964,1963,1962,1961
This statistics in other country:
AfghanistanAlbaniaAlgeriaAngolaAntigua and BarbudaArab WorldArgentinaArmeniaArubaAustraliaAustriaAzerbaijanBahamas, TheBahrainBangladeshBarbadosBelarusBelgiumBelizeBeninBhutanBoliviaBosnia and HerzegovinaBotswanaBrazilBrunei DarussalamBulgariaBurkina FasoBurundiCabo VerdeCambodiaCameroonCanadaCaribbean small statesCentral African RepublicCentral Europe and the BalticsChadChannel IslandsChileChinaColombiaComorosCongo, Dem. Rep.Congo, Rep.Costa RicaCote d'IvoireCroatiaCubaCuracaoCyprusCzech RepublicDenmarkDjiboutiDominican RepublicEarly-demographic dividendEast Asia & PacificEast Asia & Pacific (excluding high income)East Asia & Pacific (IDA & IBRD countries)EcuadorEgypt, Arab Rep.El SalvadorEquatorial GuineaEritreaEstoniaEthiopiaEuro areaEurope & Central AsiaEurope & Central Asia (excluding high income)Europe & Central Asia (IDA & IBRD countries)European UnionFijiFinlandFragile and conflict affected situationsFranceFrench PolynesiaGabonGambia, TheGeorgiaGermanyGhanaGreeceGrenadaGuamGuatemalaGuineaGuinea-BissauGuyanaHaitiHeavily indebted poor countries (HIPC)High incomeHondurasHong Kong SAR, ChinaHungaryIBRD onlyIcelandIDA & IBRD totalIDA blendIDA onlyIDA totalIndiaIndonesiaIran, Islamic Rep.IraqIrelandIsraelItalyJamaicaJapanJordanKazakhstanKenyaKiribatiKorea, Dem. People’s Rep.Korea, Rep.KuwaitKyrgyz RepublicLao PDRLate-demographic dividendLatin America & Caribbean Latin America & Caribbean (excluding high income)Latin America & the Caribbean (IDA & IBRD countries)LatviaLeast developed countries: UN classificationLebanonLesothoLiberiaLibyaLithuaniaLow & middle incomeLow incomeLower middle incomeLuxembourgMacao SAR, ChinaMacedonia, FYRMadagascarMalawiMalaysiaMaldivesMaliMaltaMauritaniaMauritiusMexicoMicronesia, Fed. Sts.Middle East & North AfricaMiddle East & North Africa (excluding high income)Middle East & North Africa (IDA & IBRD countries)Middle incomeMoldovaMongoliaMontenegroMoroccoMozambiqueMyanmarNamibiaNepalNetherlandsNew CaledoniaNew ZealandNicaraguaNigerNigeriaNorth AmericaNorwayOECD membersOmanOther small statesPacific island small statesPakistanPanamaPapua New GuineaParaguayPeruPhilippinesPolandPortugalPost-demographic dividendPre-demographic dividendPuerto RicoQatarRomaniaRussian FederationRwandaSamoaSao Tome and PrincipeSaudi ArabiaSenegalSerbiaSeychellesSierra LeoneSingaporeSlovak RepublicSloveniaSmall statesSolomon IslandsSomaliaSouth AfricaSouth AsiaSouth Asia (IDA & IBRD)South SudanSpainSri LankaSt. LuciaSt. Vincent and the GrenadinesSub-Saharan Africa Sub-Saharan Africa (excluding high income)Sub-Saharan Africa (IDA & IBRD countries)SudanSurinameSwazilandSwedenSwitzerlandSyrian Arab RepublicTajikistanTanzaniaThailandTimor-LesteTogoTongaTrinidad and TobagoTunisiaTurkeyTurkmenistanUgandaUkraineUnited Arab EmiratesUnited KingdomUnited StatesUpper middle incomeUruguayUzbekistanVanuatuVenezuela, RBVietnamVirgin Islands (U.S.)West Bank and GazaWorldYemen, Rep.ZambiaZimbabwe Timeline:
This timeline shows a graph from 1961 to 2016 of Mozambique. No data until 1960. Number of actual observations by date: 56.
Source name:
World Development Indicators
Source organization:
United Nations Population Division, World Population Prospects.
Categories, topics:
Health, Gender, Social Development
Last updated:
apr 23, 2017
Indicators value changes by year
Minimum:
127.396
jan 1, 1973
Maximum:
188.932
jan 1, 1993
At the date of observation
Value
Absolute change
Change from previous value
jan 1, 1961
127.88
+127.88
0.0%
jan 1, 1962
127.88
0.0
0.0%
jan 1, 1963
127.88
0.0
0.0%
jan 1, 1964
127.88
0.0
0.0%
jan 1, 1965
127.88
0.0
0.0%
jan 1, 1966
127.88
0.0
0.0%
jan 1, 1967
127.88
0.0
0.0%
jan 1, 1968
127.88
0.0
0.0%
jan 1, 1969
127.783
-0.097
-0.08%
jan 1, 1970
127.686
-0.097
-0.08%
jan 1, 1971
127.59
-0.097
-0.08%
jan 1, 1972
127.493
-0.097
-0.08%
jan 1, 1973
127.396
-0.097
-0.08%
jan 1, 1974
138.332
+10.936
8.58%
jan 1, 1975
149.268
+10.936
7.91%
jan 1, 1976
160.203
+10.936
7.33%
jan 1, 1977
171.139
+10.936
6.83%
jan 1, 1978
182.075
+10.936
6.39%
jan 1, 1979
181.81
-0.265
-0.15%
jan 1, 1980
181.545
-0.265
-0.15%
jan 1, 1981
181.281
-0.265
-0.15%
jan 1, 1982
181.016
-0.265
-0.15%
jan 1, 1983
180.751
-0.265
-0.15%
jan 1, 1984
180.397
-0.354
-0.2%
jan 1, 1985
180.042
-0.354
-0.2%
jan 1, 1986
179.688
-0.354
-0.2%
jan 1, 1987
179.333
-0.354
-0.2%
jan 1, 1988
178.979
-0.354
-0.2%
jan 1, 1989
180.97
+1.991
1.11%
jan 1, 1990
182.96
+1.991
1.1%
jan 1, 1991
184.951
+1.991
1.09%
jan 1, 1992
186.941
+1.991
1.08%
jan 1, 1993
188.932
+1.991
1.06%
jan 1, 1994
187.269
-1.663
-0.88%
jan 1, 1995
185.605
-1.663
-0.89%
jan 1, 1996
183.942
-1.663
-0.9%
jan 1, 1997
182.278
-1.663
-0.9%
jan 1, 1998
180.615
-1.663
-0.91%
jan 1, 1999
181.971
+1.356
0.75%
jan 1, 2000
183.327
+1.356
0.75%
jan 1, 2001
184.682
+1.356
0.74%
jan 1, 2002
186.038
+1.356
0.73%
jan 1, 2003
187.394
+1.356
0.73%
jan 1, 2004
184.633
-2.761
-1.47%
jan 1, 2005
181.872
-2.761
-1.5%
jan 1, 2006
179.111
-2.761
-1.52%
jan 1, 2007
176.35
-2.761
-1.54%
jan 1, 2008
173.589
-2.761
-1.57%
jan 1, 2009
169.62
-3.969
-2.29%
jan 1, 2010
165.651
-3.969
-2.34%
jan 1, 2011
161.683
-3.969
-2.4%
jan 1, 2012
157.714
-3.969
-2.45%
jan 1, 2013
153.745
-3.969
-2.52%
jan 1, 2014
148.139
-5.606
-3.65%
jan 1, 2015
142.533
-5.606
-3.78%
jan 1, 2016
136.928
-5.606
-3.93%
Ranking of countries by current statistics by years


Comments: