29
/
en
AIzaSyAYiBZKx7MnpbEhh9jyipgxe19OcubqV5w
April 1, 2024
280576
Venezuela, RB
VEN
true
2
1
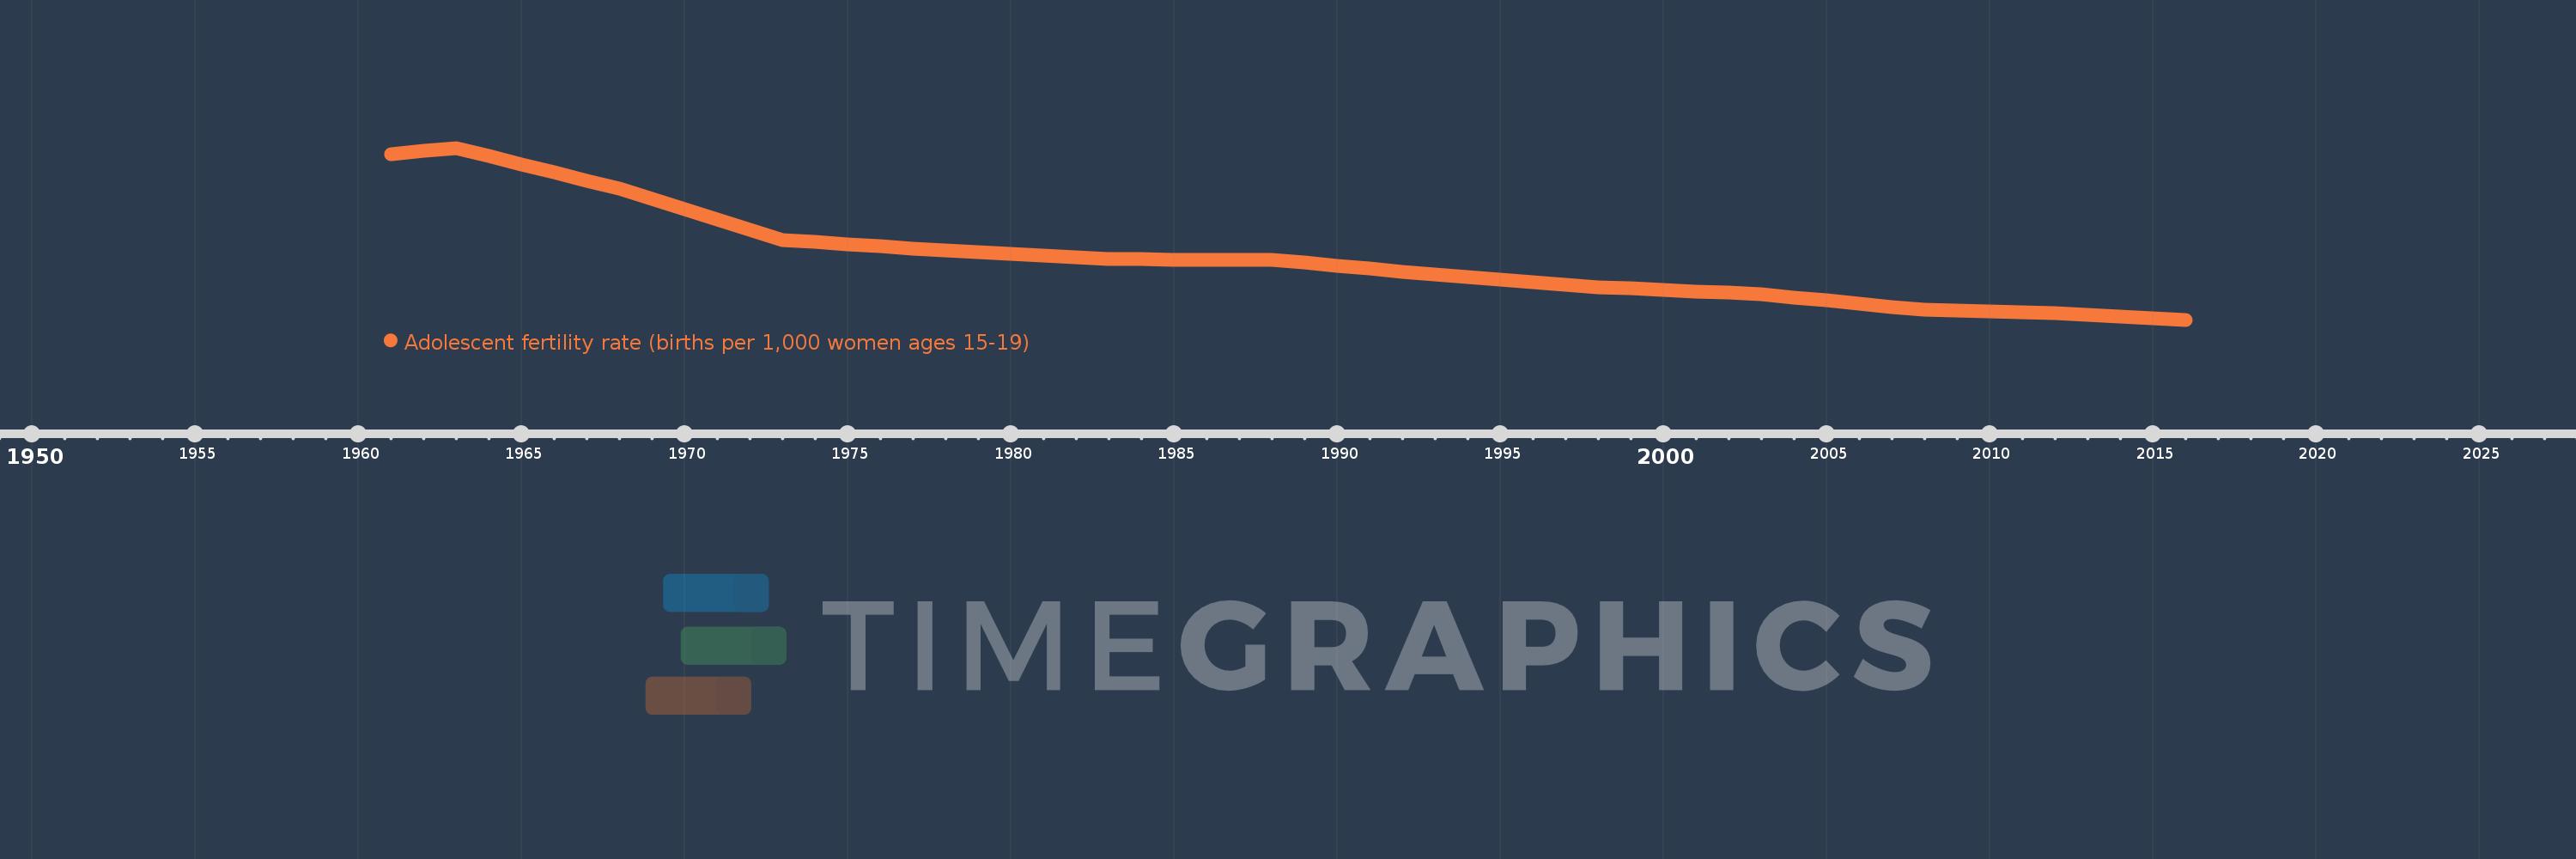
Adolescent fertility rate (births per 1,000 women ages 15-19)
2016,2015,2014,2013,2012,2011,2010,2009,2008,2007,2006,2005,2004,2003,2002,2001,2000,1999,1998,1997,1996,1995,1994,1993,1992,1991,1990,1989,1988,1987,1986,1985,1984,1983,1982,1981,1980,1979,1978,1977,1976,1975,1974,1973,1972,1971,1970,1969,1968,1967,1966,1965,1964,1963,1962,1961
This statistics in other country:
AfghanistanAlbaniaAlgeriaAngolaAntigua and BarbudaArab WorldArgentinaArmeniaArubaAustraliaAustriaAzerbaijanBahamas, TheBahrainBangladeshBarbadosBelarusBelgiumBelizeBeninBhutanBoliviaBosnia and HerzegovinaBotswanaBrazilBrunei DarussalamBulgariaBurkina FasoBurundiCabo VerdeCambodiaCameroonCanadaCaribbean small statesCentral African RepublicCentral Europe and the BalticsChadChannel IslandsChileChinaColombiaComorosCongo, Dem. Rep.Congo, Rep.Costa RicaCote d'IvoireCroatiaCubaCuracaoCyprusCzech RepublicDenmarkDjiboutiDominican RepublicEarly-demographic dividendEast Asia & PacificEast Asia & Pacific (excluding high income)East Asia & Pacific (IDA & IBRD countries)EcuadorEgypt, Arab Rep.El SalvadorEquatorial GuineaEritreaEstoniaEthiopiaEuro areaEurope & Central AsiaEurope & Central Asia (excluding high income)Europe & Central Asia (IDA & IBRD countries)European UnionFijiFinlandFragile and conflict affected situationsFranceFrench PolynesiaGabonGambia, TheGeorgiaGermanyGhanaGreeceGrenadaGuamGuatemalaGuineaGuinea-BissauGuyanaHaitiHeavily indebted poor countries (HIPC)High incomeHondurasHong Kong SAR, ChinaHungaryIBRD onlyIcelandIDA & IBRD totalIDA blendIDA onlyIDA totalIndiaIndonesiaIran, Islamic Rep.IraqIrelandIsraelItalyJamaicaJapanJordanKazakhstanKenyaKiribatiKorea, Dem. People’s Rep.Korea, Rep.KuwaitKyrgyz RepublicLao PDRLate-demographic dividendLatin America & Caribbean Latin America & Caribbean (excluding high income)Latin America & the Caribbean (IDA & IBRD countries)LatviaLeast developed countries: UN classificationLebanonLesothoLiberiaLibyaLithuaniaLow & middle incomeLow incomeLower middle incomeLuxembourgMacao SAR, ChinaMacedonia, FYRMadagascarMalawiMalaysiaMaldivesMaliMaltaMauritaniaMauritiusMexicoMicronesia, Fed. Sts.Middle East & North AfricaMiddle East & North Africa (excluding high income)Middle East & North Africa (IDA & IBRD countries)Middle incomeMoldovaMongoliaMontenegroMoroccoMozambiqueMyanmarNamibiaNepalNetherlandsNew CaledoniaNew ZealandNicaraguaNigerNigeriaNorth AmericaNorwayOECD membersOmanOther small statesPacific island small statesPakistanPanamaPapua New GuineaParaguayPeruPhilippinesPolandPortugalPost-demographic dividendPre-demographic dividendPuerto RicoQatarRomaniaRussian FederationRwandaSamoaSao Tome and PrincipeSaudi ArabiaSenegalSerbiaSeychellesSierra LeoneSingaporeSlovak RepublicSloveniaSmall statesSolomon IslandsSomaliaSouth AfricaSouth AsiaSouth Asia (IDA & IBRD)South SudanSpainSri LankaSt. LuciaSt. Vincent and the GrenadinesSub-Saharan Africa Sub-Saharan Africa (excluding high income)Sub-Saharan Africa (IDA & IBRD countries)SudanSurinameSwazilandSwedenSwitzerlandSyrian Arab RepublicTajikistanTanzaniaThailandTimor-LesteTogoTongaTrinidad and TobagoTunisiaTurkeyTurkmenistanUgandaUkraineUnited Arab EmiratesUnited KingdomUnited StatesUpper middle incomeUruguayUzbekistanVanuatuVenezuela, RBVietnamVirgin Islands (U.S.)West Bank and GazaWorldYemen, Rep.ZambiaZimbabwe Timeline:
This timeline shows a graph from 1961 to 2016 of Venezuela, RB. No data until 1960. Number of actual observations by date: 56.
Source name:
World Development Indicators
Source organization:
United Nations Population Division, World Population Prospects.
Categories, topics:
Health, Gender, Social Development
Last updated:
apr 23, 2017
Indicators value changes by year
Minimum:
79.052
jan 1, 2016
Maximum:
139.491
jan 1, 1963
At the date of observation
Value
Absolute change
Change from previous value
jan 1, 1961
137.213
+137.213
0.0%
jan 1, 1962
138.352
+1.139
0.83%
jan 1, 1963
139.491
+1.139
0.82%
jan 1, 1964
136.628
-2.863
-2.05%
jan 1, 1965
133.765
-2.863
-2.1%
jan 1, 1966
130.901
-2.863
-2.14%
jan 1, 1967
128.038
-2.863
-2.19%
jan 1, 1968
125.175
-2.863
-2.24%
jan 1, 1969
121.58
-3.595
-2.87%
jan 1, 1970
117.985
-3.595
-2.96%
jan 1, 1971
114.39
-3.595
-3.05%
jan 1, 1972
110.795
-3.595
-3.14%
jan 1, 1973
107.2
-3.595
-3.24%
jan 1, 1974
106.447
-0.753
-0.7%
jan 1, 1975
105.695
-0.753
-0.71%
jan 1, 1976
104.942
-0.753
-0.71%
jan 1, 1977
104.19
-0.753
-0.72%
jan 1, 1978
103.437
-0.753
-0.72%
jan 1, 1979
102.805
-0.632
-0.61%
jan 1, 1980
102.173
-0.632
-0.61%
jan 1, 1981
101.542
-0.632
-0.62%
jan 1, 1982
100.91
-0.632
-0.62%
jan 1, 1983
100.278
-0.632
-0.63%
jan 1, 1984
100.27
-0.008
-0.01%
jan 1, 1985
100.262
-0.008
-0.01%
jan 1, 1986
100.255
-0.008
-0.01%
jan 1, 1987
100.247
-0.008
-0.01%
jan 1, 1988
100.239
-0.008
-0.01%
jan 1, 1989
99.179
-1.06
-1.06%
jan 1, 1990
98.119
-1.06
-1.07%
jan 1, 1991
97.059
-1.06
-1.08%
jan 1, 1992
95.999
-1.06
-1.09%
jan 1, 1993
94.939
-1.06
-1.1%
jan 1, 1994
94.061
-0.878
-0.92%
jan 1, 1995
93.184
-0.878
-0.93%
jan 1, 1996
92.306
-0.878
-0.94%
jan 1, 1997
91.429
-0.878
-0.95%
jan 1, 1998
90.551
-0.878
-0.96%
jan 1, 1999
90.033
-0.518
-0.57%
jan 1, 2000
89.516
-0.518
-0.57%
jan 1, 2001
88.998
-0.518
-0.58%
jan 1, 2002
88.481
-0.518
-0.58%
jan 1, 2003
87.963
-0.518
-0.58%
jan 1, 2004
86.881
-1.082
-1.23%
jan 1, 2005
85.799
-1.082
-1.25%
jan 1, 2006
84.718
-1.082
-1.26%
jan 1, 2007
83.636
-1.082
-1.28%
jan 1, 2008
82.554
-1.082
-1.29%
jan 1, 2009
82.223
-0.331
-0.4%
jan 1, 2010
81.892
-0.331
-0.4%
jan 1, 2011
81.56
-0.331
-0.4%
jan 1, 2012
81.229
-0.331
-0.41%
jan 1, 2013
80.898
-0.331
-0.41%
jan 1, 2014
80.283
-0.615
-0.76%
jan 1, 2015
79.667
-0.615
-0.77%
jan 1, 2016
79.052
-0.615
-0.77%
Ranking of countries by current statistics by years


Comments: