29
/
en
AIzaSyAYiBZKx7MnpbEhh9jyipgxe19OcubqV5w
April 1, 2024
250463
St. Lucia
LCA
true
2
1
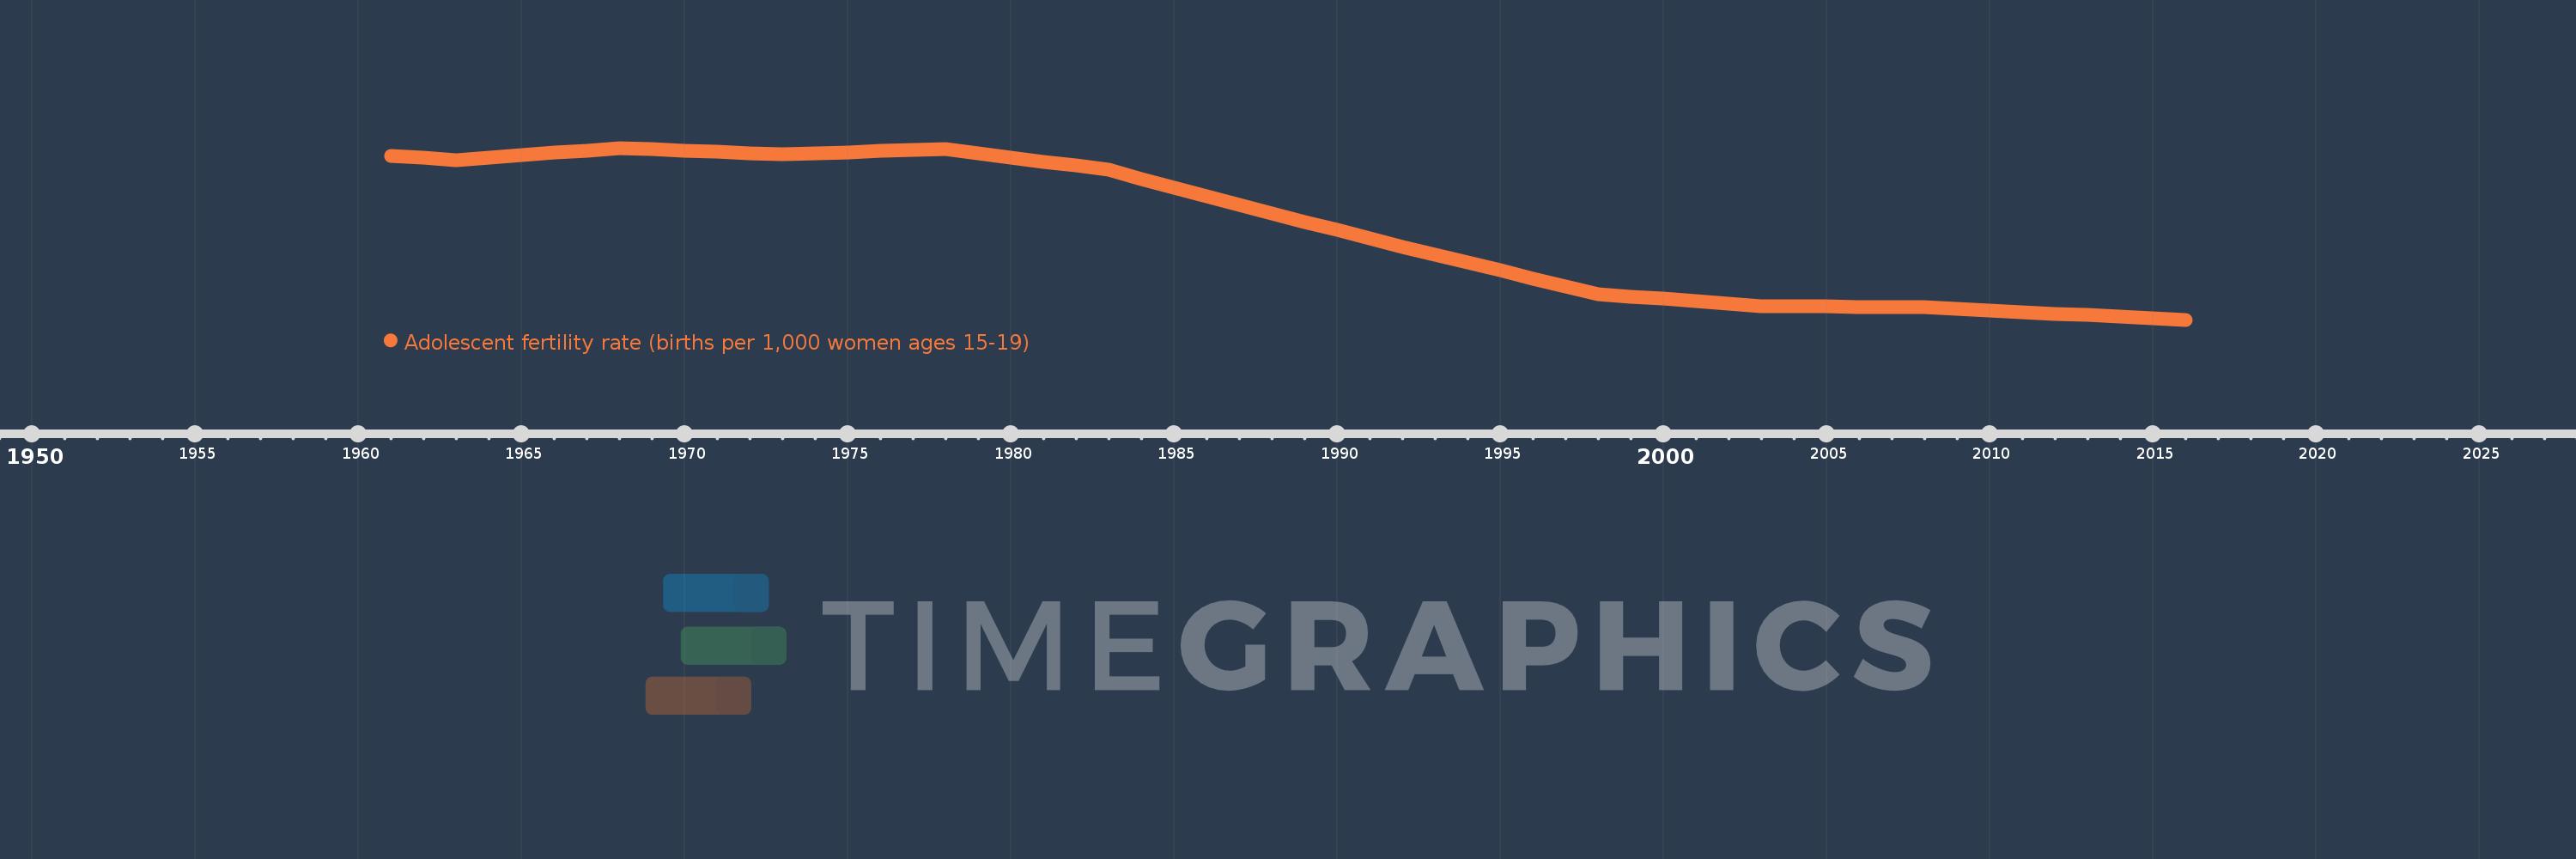
Adolescent fertility rate (births per 1,000 women ages 15-19)
2016,2015,2014,2013,2012,2011,2010,2009,2008,2007,2006,2005,2004,2003,2002,2001,2000,1999,1998,1997,1996,1995,1994,1993,1992,1991,1990,1989,1988,1987,1986,1985,1984,1983,1982,1981,1980,1979,1978,1977,1976,1975,1974,1973,1972,1971,1970,1969,1968,1967,1966,1965,1964,1963,1962,1961
This statistics in other country:
AfghanistanAlbaniaAlgeriaAngolaAntigua and BarbudaArab WorldArgentinaArmeniaArubaAustraliaAustriaAzerbaijanBahamas, TheBahrainBangladeshBarbadosBelarusBelgiumBelizeBeninBhutanBoliviaBosnia and HerzegovinaBotswanaBrazilBrunei DarussalamBulgariaBurkina FasoBurundiCabo VerdeCambodiaCameroonCanadaCaribbean small statesCentral African RepublicCentral Europe and the BalticsChadChannel IslandsChileChinaColombiaComorosCongo, Dem. Rep.Congo, Rep.Costa RicaCote d'IvoireCroatiaCubaCuracaoCyprusCzech RepublicDenmarkDjiboutiDominican RepublicEarly-demographic dividendEast Asia & PacificEast Asia & Pacific (excluding high income)East Asia & Pacific (IDA & IBRD countries)EcuadorEgypt, Arab Rep.El SalvadorEquatorial GuineaEritreaEstoniaEthiopiaEuro areaEurope & Central AsiaEurope & Central Asia (excluding high income)Europe & Central Asia (IDA & IBRD countries)European UnionFijiFinlandFragile and conflict affected situationsFranceFrench PolynesiaGabonGambia, TheGeorgiaGermanyGhanaGreeceGrenadaGuamGuatemalaGuineaGuinea-BissauGuyanaHaitiHeavily indebted poor countries (HIPC)High incomeHondurasHong Kong SAR, ChinaHungaryIBRD onlyIcelandIDA & IBRD totalIDA blendIDA onlyIDA totalIndiaIndonesiaIran, Islamic Rep.IraqIrelandIsraelItalyJamaicaJapanJordanKazakhstanKenyaKiribatiKorea, Dem. People’s Rep.Korea, Rep.KuwaitKyrgyz RepublicLao PDRLate-demographic dividendLatin America & Caribbean Latin America & Caribbean (excluding high income)Latin America & the Caribbean (IDA & IBRD countries)LatviaLeast developed countries: UN classificationLebanonLesothoLiberiaLibyaLithuaniaLow & middle incomeLow incomeLower middle incomeLuxembourgMacao SAR, ChinaMacedonia, FYRMadagascarMalawiMalaysiaMaldivesMaliMaltaMauritaniaMauritiusMexicoMicronesia, Fed. Sts.Middle East & North AfricaMiddle East & North Africa (excluding high income)Middle East & North Africa (IDA & IBRD countries)Middle incomeMoldovaMongoliaMontenegroMoroccoMozambiqueMyanmarNamibiaNepalNetherlandsNew CaledoniaNew ZealandNicaraguaNigerNigeriaNorth AmericaNorwayOECD membersOmanOther small statesPacific island small statesPakistanPanamaPapua New GuineaParaguayPeruPhilippinesPolandPortugalPost-demographic dividendPre-demographic dividendPuerto RicoQatarRomaniaRussian FederationRwandaSamoaSao Tome and PrincipeSaudi ArabiaSenegalSerbiaSeychellesSierra LeoneSingaporeSlovak RepublicSloveniaSmall statesSolomon IslandsSomaliaSouth AfricaSouth AsiaSouth Asia (IDA & IBRD)South SudanSpainSri LankaSt. LuciaSt. Vincent and the GrenadinesSub-Saharan Africa Sub-Saharan Africa (excluding high income)Sub-Saharan Africa (IDA & IBRD countries)SudanSurinameSwazilandSwedenSwitzerlandSyrian Arab RepublicTajikistanTanzaniaThailandTimor-LesteTogoTongaTrinidad and TobagoTunisiaTurkeyTurkmenistanUgandaUkraineUnited Arab EmiratesUnited KingdomUnited StatesUpper middle incomeUruguayUzbekistanVanuatuVenezuela, RBVietnamVirgin Islands (U.S.)West Bank and GazaWorldYemen, Rep.ZambiaZimbabwe Timeline:
This timeline shows a graph from 1961 to 2016 of St. Lucia. No data until 1960. Number of actual observations by date: 56.
Source name:
World Development Indicators
Source organization:
United Nations Population Division, World Population Prospects.
Categories, topics:
Health, Gender, Social Development
Last updated:
apr 23, 2017
Indicators value changes by year
Minimum:
53.425
jan 1, 2016
Maximum:
162.636
jan 1, 1968
At the date of observation
Value
Absolute change
Change from previous value
jan 1, 1961
157.603
+157.603
0.0%
jan 1, 1962
156.294
-1.309
-0.83%
jan 1, 1963
154.985
-1.309
-0.84%
jan 1, 1964
156.515
+1.53
0.99%
jan 1, 1965
158.045
+1.53
0.98%
jan 1, 1966
159.576
+1.53
0.97%
jan 1, 1967
161.106
+1.53
0.96%
jan 1, 1968
162.636
+1.53
0.95%
jan 1, 1969
161.796
-0.84
-0.52%
jan 1, 1970
160.956
-0.84
-0.52%
jan 1, 1971
160.117
-0.84
-0.52%
jan 1, 1972
159.277
-0.84
-0.52%
jan 1, 1973
158.437
-0.84
-0.53%
jan 1, 1974
159.163
+0.726
0.46%
jan 1, 1975
159.888
+0.726
0.46%
jan 1, 1976
160.614
+0.726
0.45%
jan 1, 1977
161.339
+0.726
0.45%
jan 1, 1978
162.065
+0.726
0.45%
jan 1, 1979
159.371
-2.694
-1.66%
jan 1, 1980
156.676
-2.694
-1.69%
jan 1, 1981
153.982
-2.694
-1.72%
jan 1, 1982
151.287
-2.694
-1.75%
jan 1, 1983
148.593
-2.694
-1.78%
jan 1, 1984
143.033
-5.56
-3.74%
jan 1, 1985
137.473
-5.56
-3.89%
jan 1, 1986
131.914
-5.56
-4.04%
jan 1, 1987
126.354
-5.56
-4.21%
jan 1, 1988
120.794
-5.56
-4.4%
jan 1, 1989
115.561
-5.233
-4.33%
jan 1, 1990
110.327
-5.233
-4.53%
jan 1, 1991
105.094
-5.233
-4.74%
jan 1, 1992
99.86
-5.233
-4.98%
jan 1, 1993
94.627
-5.233
-5.24%
jan 1, 1994
89.663
-4.964
-5.25%
jan 1, 1995
84.698
-4.964
-5.54%
jan 1, 1996
79.734
-4.964
-5.86%
jan 1, 1997
74.769
-4.964
-6.23%
jan 1, 1998
69.805
-4.964
-6.64%
jan 1, 1999
68.234
-1.571
-2.25%
jan 1, 2000
66.663
-1.571
-2.3%
jan 1, 2001
65.092
-1.571
-2.36%
jan 1, 2002
63.521
-1.571
-2.41%
jan 1, 2003
61.95
-1.571
-2.47%
jan 1, 2004
61.841
-0.109
-0.18%
jan 1, 2005
61.732
-0.109
-0.18%
jan 1, 2006
61.622
-0.109
-0.18%
jan 1, 2007
61.513
-0.109
-0.18%
jan 1, 2008
61.404
-0.109
-0.18%
jan 1, 2009
60.385
-1.019
-1.66%
jan 1, 2010
59.366
-1.019
-1.69%
jan 1, 2011
58.347
-1.019
-1.72%
jan 1, 2012
57.328
-1.019
-1.75%
jan 1, 2013
56.309
-1.019
-1.78%
jan 1, 2014
55.348
-0.961
-1.71%
jan 1, 2015
54.386
-0.961
-1.74%
jan 1, 2016
53.425
-0.961
-1.77%
Ranking of countries by current statistics by years


Comments: