29
/
en
AIzaSyAYiBZKx7MnpbEhh9jyipgxe19OcubqV5w
April 1, 2024
27055
East Asia & Pacific
EAS
false
2
1
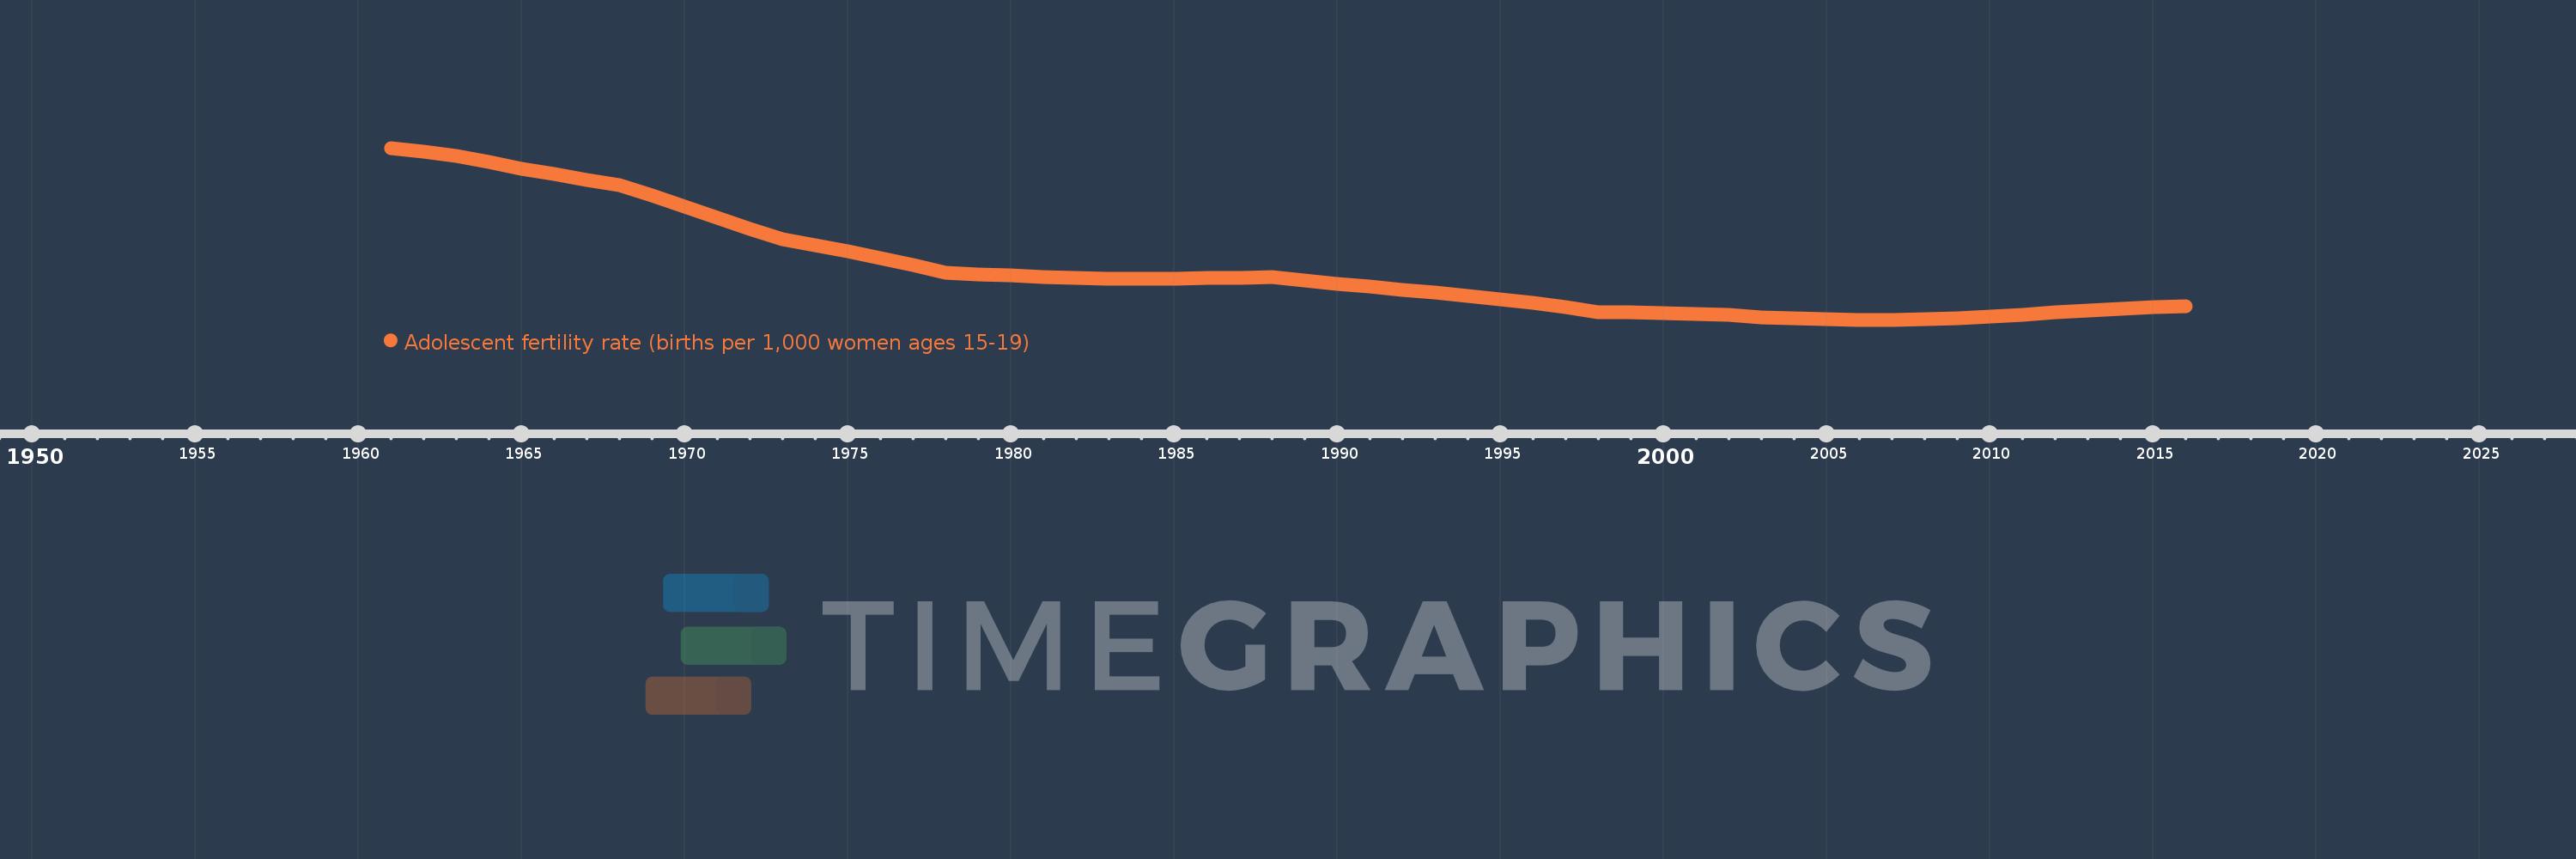
Adolescent fertility rate (births per 1,000 women ages 15-19)
2016,2015,2014,2013,2012,2011,2010,2009,2008,2007,2006,2005,2004,2003,2002,2001,2000,1999,1998,1997,1996,1995,1994,1993,1992,1991,1990,1989,1988,1987,1986,1985,1984,1983,1982,1981,1980,1979,1978,1977,1976,1975,1974,1973,1972,1971,1970,1969,1968,1967,1966,1965,1964,1963,1962,1961
This statistics in other country:
AfghanistanAlbaniaAlgeriaAngolaAntigua and BarbudaArab WorldArgentinaArmeniaArubaAustraliaAustriaAzerbaijanBahamas, TheBahrainBangladeshBarbadosBelarusBelgiumBelizeBeninBhutanBoliviaBosnia and HerzegovinaBotswanaBrazilBrunei DarussalamBulgariaBurkina FasoBurundiCabo VerdeCambodiaCameroonCanadaCaribbean small statesCentral African RepublicCentral Europe and the BalticsChadChannel IslandsChileChinaColombiaComorosCongo, Dem. Rep.Congo, Rep.Costa RicaCote d'IvoireCroatiaCubaCuracaoCyprusCzech RepublicDenmarkDjiboutiDominican RepublicEarly-demographic dividendEast Asia & PacificEast Asia & Pacific (excluding high income)East Asia & Pacific (IDA & IBRD countries)EcuadorEgypt, Arab Rep.El SalvadorEquatorial GuineaEritreaEstoniaEthiopiaEuro areaEurope & Central AsiaEurope & Central Asia (excluding high income)Europe & Central Asia (IDA & IBRD countries)European UnionFijiFinlandFragile and conflict affected situationsFranceFrench PolynesiaGabonGambia, TheGeorgiaGermanyGhanaGreeceGrenadaGuamGuatemalaGuineaGuinea-BissauGuyanaHaitiHeavily indebted poor countries (HIPC)High incomeHondurasHong Kong SAR, ChinaHungaryIBRD onlyIcelandIDA & IBRD totalIDA blendIDA onlyIDA totalIndiaIndonesiaIran, Islamic Rep.IraqIrelandIsraelItalyJamaicaJapanJordanKazakhstanKenyaKiribatiKorea, Dem. People’s Rep.Korea, Rep.KuwaitKyrgyz RepublicLao PDRLate-demographic dividendLatin America & Caribbean Latin America & Caribbean (excluding high income)Latin America & the Caribbean (IDA & IBRD countries)LatviaLeast developed countries: UN classificationLebanonLesothoLiberiaLibyaLithuaniaLow & middle incomeLow incomeLower middle incomeLuxembourgMacao SAR, ChinaMacedonia, FYRMadagascarMalawiMalaysiaMaldivesMaliMaltaMauritaniaMauritiusMexicoMicronesia, Fed. Sts.Middle East & North AfricaMiddle East & North Africa (excluding high income)Middle East & North Africa (IDA & IBRD countries)Middle incomeMoldovaMongoliaMontenegroMoroccoMozambiqueMyanmarNamibiaNepalNetherlandsNew CaledoniaNew ZealandNicaraguaNigerNigeriaNorth AmericaNorwayOECD membersOmanOther small statesPacific island small statesPakistanPanamaPapua New GuineaParaguayPeruPhilippinesPolandPortugalPost-demographic dividendPre-demographic dividendPuerto RicoQatarRomaniaRussian FederationRwandaSamoaSao Tome and PrincipeSaudi ArabiaSenegalSerbiaSeychellesSierra LeoneSingaporeSlovak RepublicSloveniaSmall statesSolomon IslandsSomaliaSouth AfricaSouth AsiaSouth Asia (IDA & IBRD)South SudanSpainSri LankaSt. LuciaSt. Vincent and the GrenadinesSub-Saharan Africa Sub-Saharan Africa (excluding high income)Sub-Saharan Africa (IDA & IBRD countries)SudanSurinameSwazilandSwedenSwitzerlandSyrian Arab RepublicTajikistanTanzaniaThailandTimor-LesteTogoTongaTrinidad and TobagoTunisiaTurkeyTurkmenistanUgandaUkraineUnited Arab EmiratesUnited KingdomUnited StatesUpper middle incomeUruguayUzbekistanVanuatuVenezuela, RBVietnamVirgin Islands (U.S.)West Bank and GazaWorldYemen, Rep.ZambiaZimbabwe Timeline:
This timeline shows a graph from 1961 to 2016 of East Asia & Pacific. No data until 1960. Number of actual observations by date: 56.
Source name:
World Development Indicators
Source organization:
United Nations Population Division, World Population Prospects.
Categories, topics:
Health, Gender, Social Development
Last updated:
apr 23, 2017
Indicators value changes by year
Minimum:
17.849
jan 1, 2006
Maximum:
66.016
jan 1, 1961
At the date of observation
Value
Absolute change
Change from previous value
jan 1, 1961
66.016
+66.016
0.0%
jan 1, 1962
64.911
-1.105
-1.67%
jan 1, 1963
63.857
-1.054
-1.62%
jan 1, 1964
61.988
-1.869
-2.93%
jan 1, 1965
60.224
-1.765
-2.85%
jan 1, 1966
58.604
-1.62
-2.69%
jan 1, 1967
57.065
-1.539
-2.63%
jan 1, 1968
55.604
-1.462
-2.56%
jan 1, 1969
52.587
-3.017
-5.43%
jan 1, 1970
49.474
-3.113
-5.92%
jan 1, 1971
46.398
-3.075
-6.22%
jan 1, 1972
43.362
-3.036
-6.54%
jan 1, 1973
40.46
-2.902
-6.69%
jan 1, 1974
38.78
-1.68
-4.15%
jan 1, 1975
37.06
-1.72
-4.44%
jan 1, 1976
35.209
-1.851
-4.99%
jan 1, 1977
33.183
-2.027
-5.76%
jan 1, 1978
30.972
-2.211
-6.66%
jan 1, 1979
30.64
-0.332
-1.07%
jan 1, 1980
30.27
-0.37
-1.21%
jan 1, 1981
29.931
-0.339
-1.12%
jan 1, 1982
29.569
-0.362
-1.21%
jan 1, 1983
29.232
-0.337
-1.14%
jan 1, 1984
29.243
+0.012
0.04%
jan 1, 1985
29.337
+0.094
0.32%
jan 1, 1986
29.494
+0.157
0.54%
jan 1, 1987
29.68
+0.185
0.63%
jan 1, 1988
29.879
+0.199
0.67%
jan 1, 1989
28.875
-1.004
-3.36%
jan 1, 1990
27.936
-0.939
-3.25%
jan 1, 1991
27.068
-0.868
-3.11%
jan 1, 1992
26.291
-0.777
-2.87%
jan 1, 1993
25.591
-0.7
-2.66%
jan 1, 1994
24.614
-0.978
-3.82%
jan 1, 1995
23.614
-1.0
-4.06%
jan 1, 1996
22.541
-1.073
-4.54%
jan 1, 1997
21.317
-1.224
-5.43%
jan 1, 1998
20.024
-1.293
-6.06%
jan 1, 1999
19.97
-0.054
-0.27%
jan 1, 2000
19.809
-0.16
-0.8%
jan 1, 2001
19.532
-0.277
-1.4%
jan 1, 2002
19.12
-0.412
-2.11%
jan 1, 2003
18.603
-0.517
-2.7%
jan 1, 2004
18.205
-0.398
-2.14%
jan 1, 2005
17.936
-0.269
-1.48%
jan 1, 2006
17.849
-0.087
-0.49%
jan 1, 2007
17.851
+0.002
0.01%
jan 1, 2008
18.013
+0.162
0.91%
jan 1, 2009
18.373
+0.36
2.0%
jan 1, 2010
18.823
+0.45
2.45%
jan 1, 2011
19.295
+0.471
2.5%
jan 1, 2012
19.824
+0.529
2.74%
jan 1, 2013
20.367
+0.543
2.74%
jan 1, 2014
20.863
+0.496
2.43%
jan 1, 2015
21.314
+0.451
2.16%
jan 1, 2016
21.694
+0.38
1.78%
Ranking of countries by current statistics by years


Comments: