29
/
en
AIzaSyAYiBZKx7MnpbEhh9jyipgxe19OcubqV5w
April 1, 2024
197114
Moldova
MDA
true
2
1
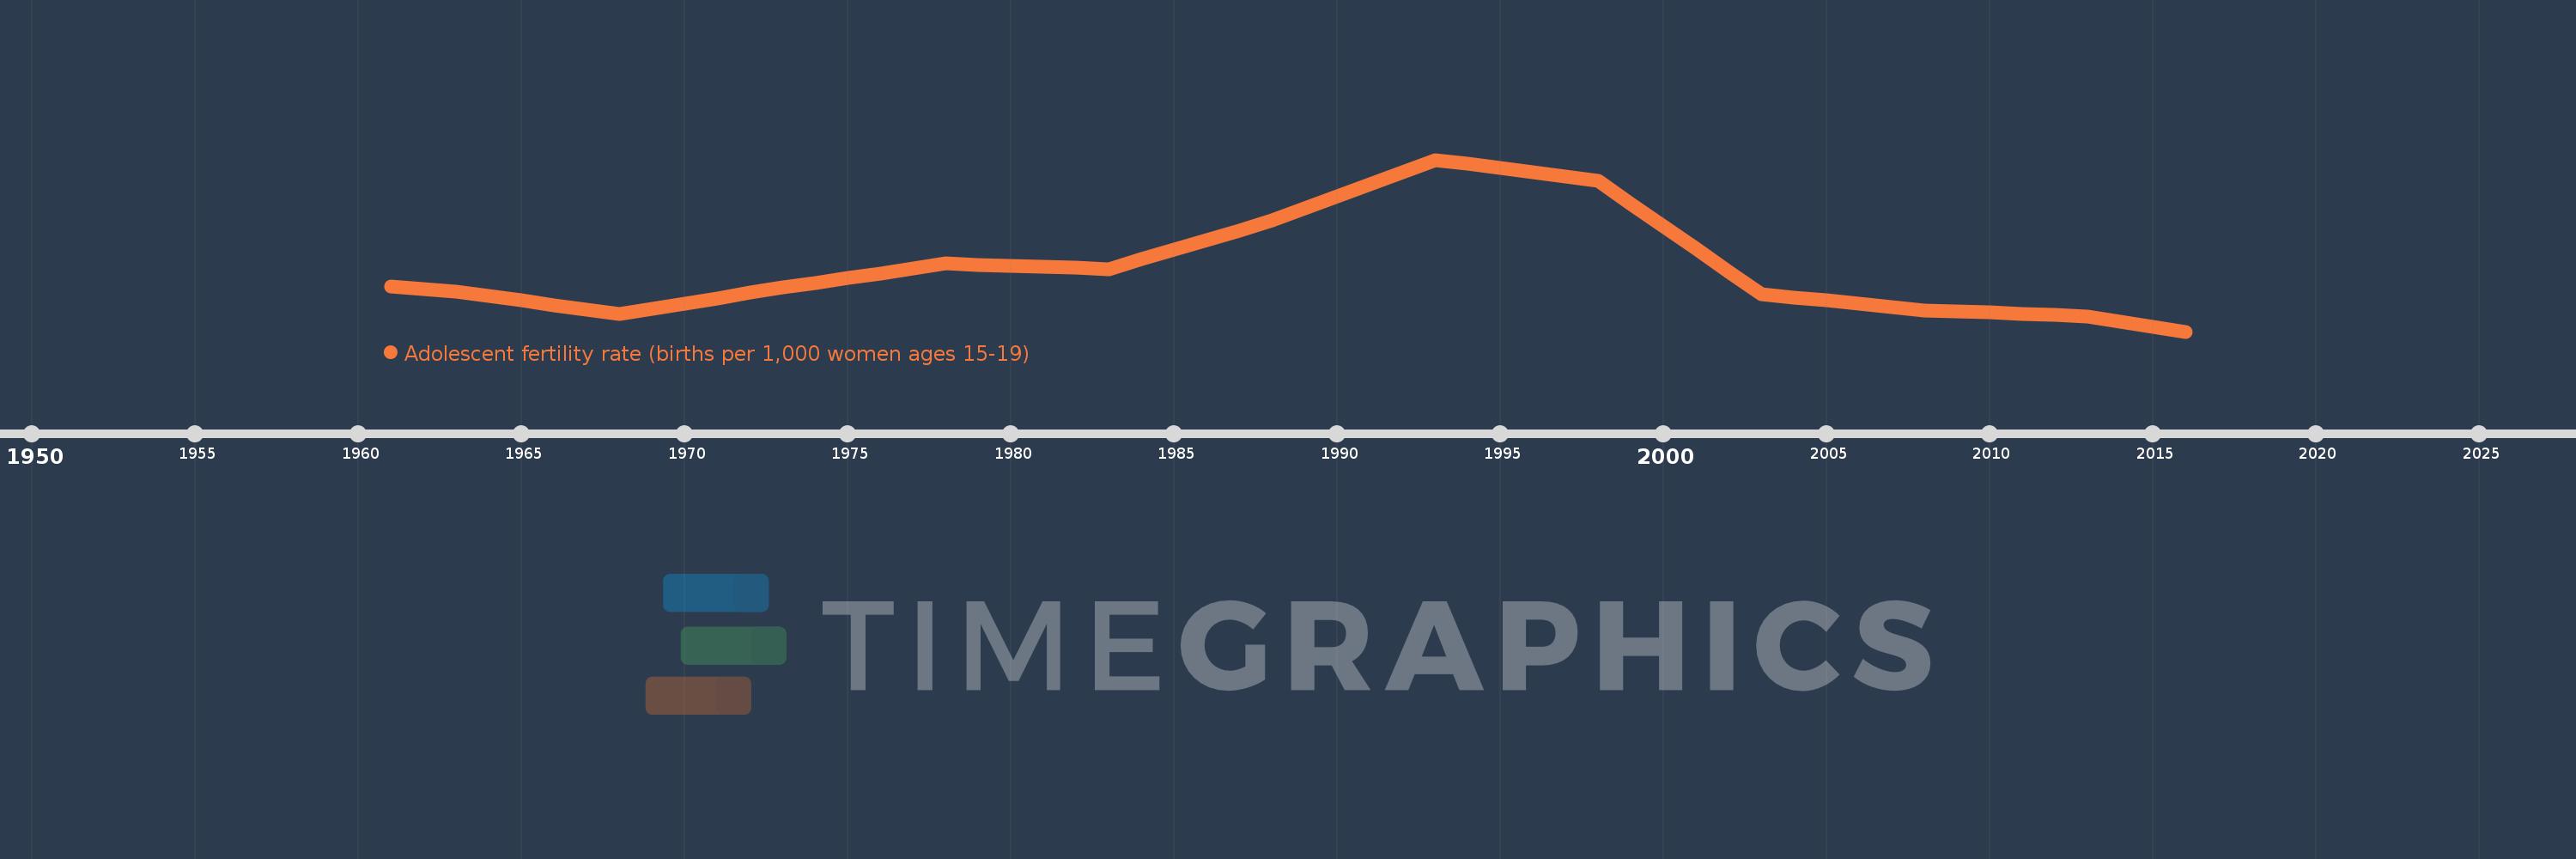
Adolescent fertility rate (births per 1,000 women ages 15-19)
2016,2015,2014,2013,2012,2011,2010,2009,2008,2007,2006,2005,2004,2003,2002,2001,2000,1999,1998,1997,1996,1995,1994,1993,1992,1991,1990,1989,1988,1987,1986,1985,1984,1983,1982,1981,1980,1979,1978,1977,1976,1975,1974,1973,1972,1971,1970,1969,1968,1967,1966,1965,1964,1963,1962,1961
This statistics in other country:
AfghanistanAlbaniaAlgeriaAngolaAntigua and BarbudaArab WorldArgentinaArmeniaArubaAustraliaAustriaAzerbaijanBahamas, TheBahrainBangladeshBarbadosBelarusBelgiumBelizeBeninBhutanBoliviaBosnia and HerzegovinaBotswanaBrazilBrunei DarussalamBulgariaBurkina FasoBurundiCabo VerdeCambodiaCameroonCanadaCaribbean small statesCentral African RepublicCentral Europe and the BalticsChadChannel IslandsChileChinaColombiaComorosCongo, Dem. Rep.Congo, Rep.Costa RicaCote d'IvoireCroatiaCubaCuracaoCyprusCzech RepublicDenmarkDjiboutiDominican RepublicEarly-demographic dividendEast Asia & PacificEast Asia & Pacific (excluding high income)East Asia & Pacific (IDA & IBRD countries)EcuadorEgypt, Arab Rep.El SalvadorEquatorial GuineaEritreaEstoniaEthiopiaEuro areaEurope & Central AsiaEurope & Central Asia (excluding high income)Europe & Central Asia (IDA & IBRD countries)European UnionFijiFinlandFragile and conflict affected situationsFranceFrench PolynesiaGabonGambia, TheGeorgiaGermanyGhanaGreeceGrenadaGuamGuatemalaGuineaGuinea-BissauGuyanaHaitiHeavily indebted poor countries (HIPC)High incomeHondurasHong Kong SAR, ChinaHungaryIBRD onlyIcelandIDA & IBRD totalIDA blendIDA onlyIDA totalIndiaIndonesiaIran, Islamic Rep.IraqIrelandIsraelItalyJamaicaJapanJordanKazakhstanKenyaKiribatiKorea, Dem. People’s Rep.Korea, Rep.KuwaitKyrgyz RepublicLao PDRLate-demographic dividendLatin America & Caribbean Latin America & Caribbean (excluding high income)Latin America & the Caribbean (IDA & IBRD countries)LatviaLeast developed countries: UN classificationLebanonLesothoLiberiaLibyaLithuaniaLow & middle incomeLow incomeLower middle incomeLuxembourgMacao SAR, ChinaMacedonia, FYRMadagascarMalawiMalaysiaMaldivesMaliMaltaMauritaniaMauritiusMexicoMicronesia, Fed. Sts.Middle East & North AfricaMiddle East & North Africa (excluding high income)Middle East & North Africa (IDA & IBRD countries)Middle incomeMoldovaMongoliaMontenegroMoroccoMozambiqueMyanmarNamibiaNepalNetherlandsNew CaledoniaNew ZealandNicaraguaNigerNigeriaNorth AmericaNorwayOECD membersOmanOther small statesPacific island small statesPakistanPanamaPapua New GuineaParaguayPeruPhilippinesPolandPortugalPost-demographic dividendPre-demographic dividendPuerto RicoQatarRomaniaRussian FederationRwandaSamoaSao Tome and PrincipeSaudi ArabiaSenegalSerbiaSeychellesSierra LeoneSingaporeSlovak RepublicSloveniaSmall statesSolomon IslandsSomaliaSouth AfricaSouth AsiaSouth Asia (IDA & IBRD)South SudanSpainSri LankaSt. LuciaSt. Vincent and the GrenadinesSub-Saharan Africa Sub-Saharan Africa (excluding high income)Sub-Saharan Africa (IDA & IBRD countries)SudanSurinameSwazilandSwedenSwitzerlandSyrian Arab RepublicTajikistanTanzaniaThailandTimor-LesteTogoTongaTrinidad and TobagoTunisiaTurkeyTurkmenistanUgandaUkraineUnited Arab EmiratesUnited KingdomUnited StatesUpper middle incomeUruguayUzbekistanVanuatuVenezuela, RBVietnamVirgin Islands (U.S.)West Bank and GazaWorldYemen, Rep.ZambiaZimbabwe Timeline:
This timeline shows a graph from 1961 to 2016 of Moldova. No data until 1960. Number of actual observations by date: 56.
Source name:
World Development Indicators
Source organization:
United Nations Population Division, World Population Prospects.
Categories, topics:
Health, Gender, Social Development
Last updated:
apr 23, 2017
Indicators value changes by year
Minimum:
22.028
jan 1, 2016
Maximum:
63.178
jan 1, 1993
At the date of observation
Value
Absolute change
Change from previous value
jan 1, 1961
32.804
+32.804
0.0%
jan 1, 1962
32.221
-0.582
-1.78%
jan 1, 1963
31.639
-0.582
-1.81%
jan 1, 1964
30.543
-1.096
-3.46%
jan 1, 1965
29.447
-1.096
-3.59%
jan 1, 1966
28.35
-1.096
-3.72%
jan 1, 1967
27.254
-1.096
-3.87%
jan 1, 1968
26.158
-1.096
-4.02%
jan 1, 1969
27.442
+1.284
4.91%
jan 1, 1970
28.726
+1.284
4.68%
jan 1, 1971
30.011
+1.284
4.47%
jan 1, 1972
31.295
+1.284
4.28%
jan 1, 1973
32.579
+1.284
4.1%
jan 1, 1974
33.726
+1.147
3.52%
jan 1, 1975
34.873
+1.147
3.4%
jan 1, 1976
36.019
+1.147
3.29%
jan 1, 1977
37.166
+1.147
3.18%
jan 1, 1978
38.313
+1.147
3.09%
jan 1, 1979
38.05
-0.263
-0.69%
jan 1, 1980
37.786
-0.263
-0.69%
jan 1, 1981
37.523
-0.263
-0.7%
jan 1, 1982
37.259
-0.263
-0.7%
jan 1, 1983
36.996
-0.263
-0.71%
jan 1, 1984
39.318
+2.322
6.28%
jan 1, 1985
41.641
+2.322
5.91%
jan 1, 1986
43.963
+2.322
5.58%
jan 1, 1987
46.286
+2.322
5.28%
jan 1, 1988
48.608
+2.322
5.02%
jan 1, 1989
51.522
+2.914
5.99%
jan 1, 1990
54.436
+2.914
5.66%
jan 1, 1991
57.35
+2.914
5.35%
jan 1, 1992
60.264
+2.914
5.08%
jan 1, 1993
63.178
+2.914
4.84%
jan 1, 1994
62.157
-1.021
-1.62%
jan 1, 1995
61.136
-1.021
-1.64%
jan 1, 1996
60.114
-1.021
-1.67%
jan 1, 1997
59.093
-1.021
-1.7%
jan 1, 1998
58.072
-1.021
-1.73%
jan 1, 1999
52.649
-5.423
-9.34%
jan 1, 2000
47.225
-5.423
-10.3%
jan 1, 2001
41.802
-5.423
-11.48%
jan 1, 2002
36.378
-5.423
-12.97%
jan 1, 2003
30.955
-5.423
-14.91%
jan 1, 2004
30.197
-0.758
-2.45%
jan 1, 2005
29.439
-0.758
-2.51%
jan 1, 2006
28.68
-0.758
-2.58%
jan 1, 2007
27.922
-0.758
-2.64%
jan 1, 2008
27.164
-0.758
-2.72%
jan 1, 2009
26.862
-0.302
-1.11%
jan 1, 2010
26.559
-0.302
-1.13%
jan 1, 2011
26.257
-0.302
-1.14%
jan 1, 2012
25.954
-0.302
-1.15%
jan 1, 2013
25.652
-0.302
-1.17%
jan 1, 2014
24.444
-1.208
-4.71%
jan 1, 2015
23.236
-1.208
-4.94%
jan 1, 2016
22.028
-1.208
-5.2%
Ranking of countries by current statistics by years


Comments: