29
/
en
AIzaSyAYiBZKx7MnpbEhh9jyipgxe19OcubqV5w
April 1, 2024
73628
Austria
AUT
true
2
1
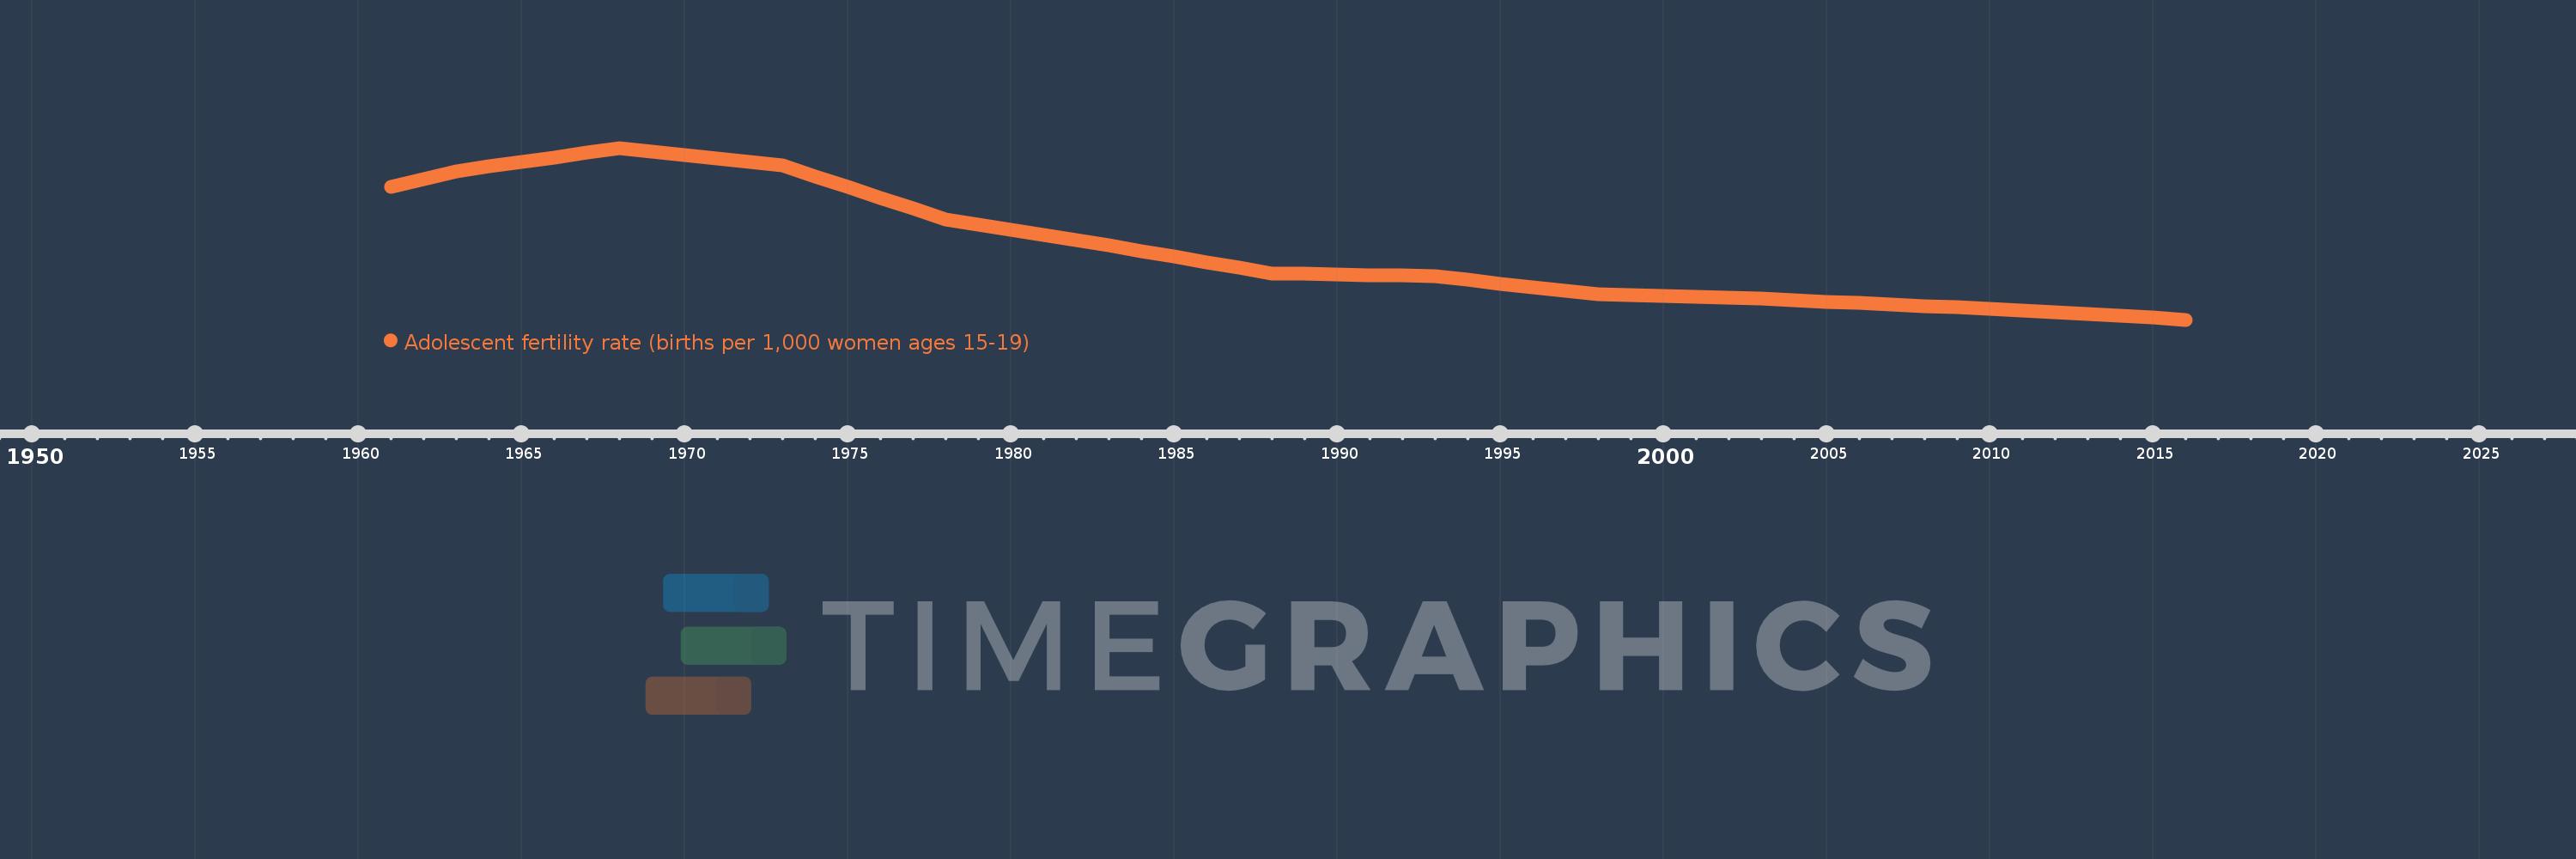
Adolescent fertility rate (births per 1,000 women ages 15-19)
2016,2015,2014,2013,2012,2011,2010,2009,2008,2007,2006,2005,2004,2003,2002,2001,2000,1999,1998,1997,1996,1995,1994,1993,1992,1991,1990,1989,1988,1987,1986,1985,1984,1983,1982,1981,1980,1979,1978,1977,1976,1975,1974,1973,1972,1971,1970,1969,1968,1967,1966,1965,1964,1963,1962,1961
This statistics in other country:
AfghanistanAlbaniaAlgeriaAngolaAntigua and BarbudaArab WorldArgentinaArmeniaArubaAustraliaAustriaAzerbaijanBahamas, TheBahrainBangladeshBarbadosBelarusBelgiumBelizeBeninBhutanBoliviaBosnia and HerzegovinaBotswanaBrazilBrunei DarussalamBulgariaBurkina FasoBurundiCabo VerdeCambodiaCameroonCanadaCaribbean small statesCentral African RepublicCentral Europe and the BalticsChadChannel IslandsChileChinaColombiaComorosCongo, Dem. Rep.Congo, Rep.Costa RicaCote d'IvoireCroatiaCubaCuracaoCyprusCzech RepublicDenmarkDjiboutiDominican RepublicEarly-demographic dividendEast Asia & PacificEast Asia & Pacific (excluding high income)East Asia & Pacific (IDA & IBRD countries)EcuadorEgypt, Arab Rep.El SalvadorEquatorial GuineaEritreaEstoniaEthiopiaEuro areaEurope & Central AsiaEurope & Central Asia (excluding high income)Europe & Central Asia (IDA & IBRD countries)European UnionFijiFinlandFragile and conflict affected situationsFranceFrench PolynesiaGabonGambia, TheGeorgiaGermanyGhanaGreeceGrenadaGuamGuatemalaGuineaGuinea-BissauGuyanaHaitiHeavily indebted poor countries (HIPC)High incomeHondurasHong Kong SAR, ChinaHungaryIBRD onlyIcelandIDA & IBRD totalIDA blendIDA onlyIDA totalIndiaIndonesiaIran, Islamic Rep.IraqIrelandIsraelItalyJamaicaJapanJordanKazakhstanKenyaKiribatiKorea, Dem. People’s Rep.Korea, Rep.KuwaitKyrgyz RepublicLao PDRLate-demographic dividendLatin America & Caribbean Latin America & Caribbean (excluding high income)Latin America & the Caribbean (IDA & IBRD countries)LatviaLeast developed countries: UN classificationLebanonLesothoLiberiaLibyaLithuaniaLow & middle incomeLow incomeLower middle incomeLuxembourgMacao SAR, ChinaMacedonia, FYRMadagascarMalawiMalaysiaMaldivesMaliMaltaMauritaniaMauritiusMexicoMicronesia, Fed. Sts.Middle East & North AfricaMiddle East & North Africa (excluding high income)Middle East & North Africa (IDA & IBRD countries)Middle incomeMoldovaMongoliaMontenegroMoroccoMozambiqueMyanmarNamibiaNepalNetherlandsNew CaledoniaNew ZealandNicaraguaNigerNigeriaNorth AmericaNorwayOECD membersOmanOther small statesPacific island small statesPakistanPanamaPapua New GuineaParaguayPeruPhilippinesPolandPortugalPost-demographic dividendPre-demographic dividendPuerto RicoQatarRomaniaRussian FederationRwandaSamoaSao Tome and PrincipeSaudi ArabiaSenegalSerbiaSeychellesSierra LeoneSingaporeSlovak RepublicSloveniaSmall statesSolomon IslandsSomaliaSouth AfricaSouth AsiaSouth Asia (IDA & IBRD)South SudanSpainSri LankaSt. LuciaSt. Vincent and the GrenadinesSub-Saharan Africa Sub-Saharan Africa (excluding high income)Sub-Saharan Africa (IDA & IBRD countries)SudanSurinameSwazilandSwedenSwitzerlandSyrian Arab RepublicTajikistanTanzaniaThailandTimor-LesteTogoTongaTrinidad and TobagoTunisiaTurkeyTurkmenistanUgandaUkraineUnited Arab EmiratesUnited KingdomUnited StatesUpper middle incomeUruguayUzbekistanVanuatuVenezuela, RBVietnamVirgin Islands (U.S.)West Bank and GazaWorldYemen, Rep.ZambiaZimbabwe Timeline:
This timeline shows a graph from 1961 to 2016 of Austria. No data until 1960. Number of actual observations by date: 56.
Source name:
World Development Indicators
Source organization:
United Nations Population Division, World Population Prospects.
Categories, topics:
Health, Gender, Social Development
Last updated:
apr 23, 2017
Indicators value changes by year
Maximum:
60.677
jan 1, 1968
At the date of observation
Value
Absolute change
Change from previous value
jan 1, 1961
48.391
+48.391
0.0%
jan 1, 1962
50.892
+2.501
5.17%
jan 1, 1963
53.393
+2.501
4.91%
jan 1, 1964
54.85
+1.457
2.73%
jan 1, 1965
56.307
+1.457
2.66%
jan 1, 1966
57.763
+1.457
2.59%
jan 1, 1967
59.22
+1.457
2.52%
jan 1, 1968
60.677
+1.457
2.46%
jan 1, 1969
59.565
-1.112
-1.83%
jan 1, 1970
58.452
-1.112
-1.87%
jan 1, 1971
57.34
-1.112
-1.9%
jan 1, 1972
56.227
-1.112
-1.94%
jan 1, 1973
55.115
-1.112
-1.98%
jan 1, 1974
51.739
-3.376
-6.13%
jan 1, 1975
48.363
-3.376
-6.53%
jan 1, 1976
44.986
-3.376
-6.98%
jan 1, 1977
41.61
-3.376
-7.5%
jan 1, 1978
38.234
-3.376
-8.11%
jan 1, 1979
36.613
-1.621
-4.24%
jan 1, 1980
34.991
-1.621
-4.43%
jan 1, 1981
33.37
-1.621
-4.63%
jan 1, 1982
31.748
-1.621
-4.86%
jan 1, 1983
30.127
-1.621
-5.11%
jan 1, 1984
28.378
-1.749
-5.8%
jan 1, 1985
26.63
-1.749
-6.16%
jan 1, 1986
24.881
-1.749
-6.57%
jan 1, 1987
23.133
-1.749
-7.03%
jan 1, 1988
21.384
-1.749
-7.56%
jan 1, 1989
21.185
-0.199
-0.93%
jan 1, 1990
20.986
-0.199
-0.94%
jan 1, 1991
20.787
-0.199
-0.95%
jan 1, 1992
20.588
-0.199
-0.96%
jan 1, 1993
20.389
-0.199
-0.97%
jan 1, 1994
19.269
-1.12
-5.49%
jan 1, 1995
18.149
-1.12
-5.81%
jan 1, 1996
17.029
-1.12
-6.17%
jan 1, 1997
15.909
-1.12
-6.58%
jan 1, 1998
14.789
-1.12
-7.04%
jan 1, 1999
14.5
-0.289
-1.95%
jan 1, 2000
14.212
-0.289
-1.99%
jan 1, 2001
13.923
-0.289
-2.03%
jan 1, 2002
13.635
-0.289
-2.07%
jan 1, 2003
13.346
-0.289
-2.12%
jan 1, 2004
12.902
-0.444
-3.33%
jan 1, 2005
12.458
-0.444
-3.44%
jan 1, 2006
12.014
-0.444
-3.56%
jan 1, 2007
11.57
-0.444
-3.7%
jan 1, 2008
11.126
-0.444
-3.84%
jan 1, 2009
10.614
-0.512
-4.6%
jan 1, 2010
10.102
-0.512
-4.83%
jan 1, 2011
9.589
-0.512
-5.07%
jan 1, 2012
9.077
-0.512
-5.34%
jan 1, 2013
8.565
-0.512
-5.64%
jan 1, 2014
7.972
-0.593
-6.92%
jan 1, 2015
7.379
-0.593
-7.44%
jan 1, 2016
6.786
-0.593
-8.04%
Ranking of countries by current statistics by years


Comments: