29
/
en
AIzaSyAYiBZKx7MnpbEhh9jyipgxe19OcubqV5w
April 1, 2024
231932
Samoa
WSM
true
2
1
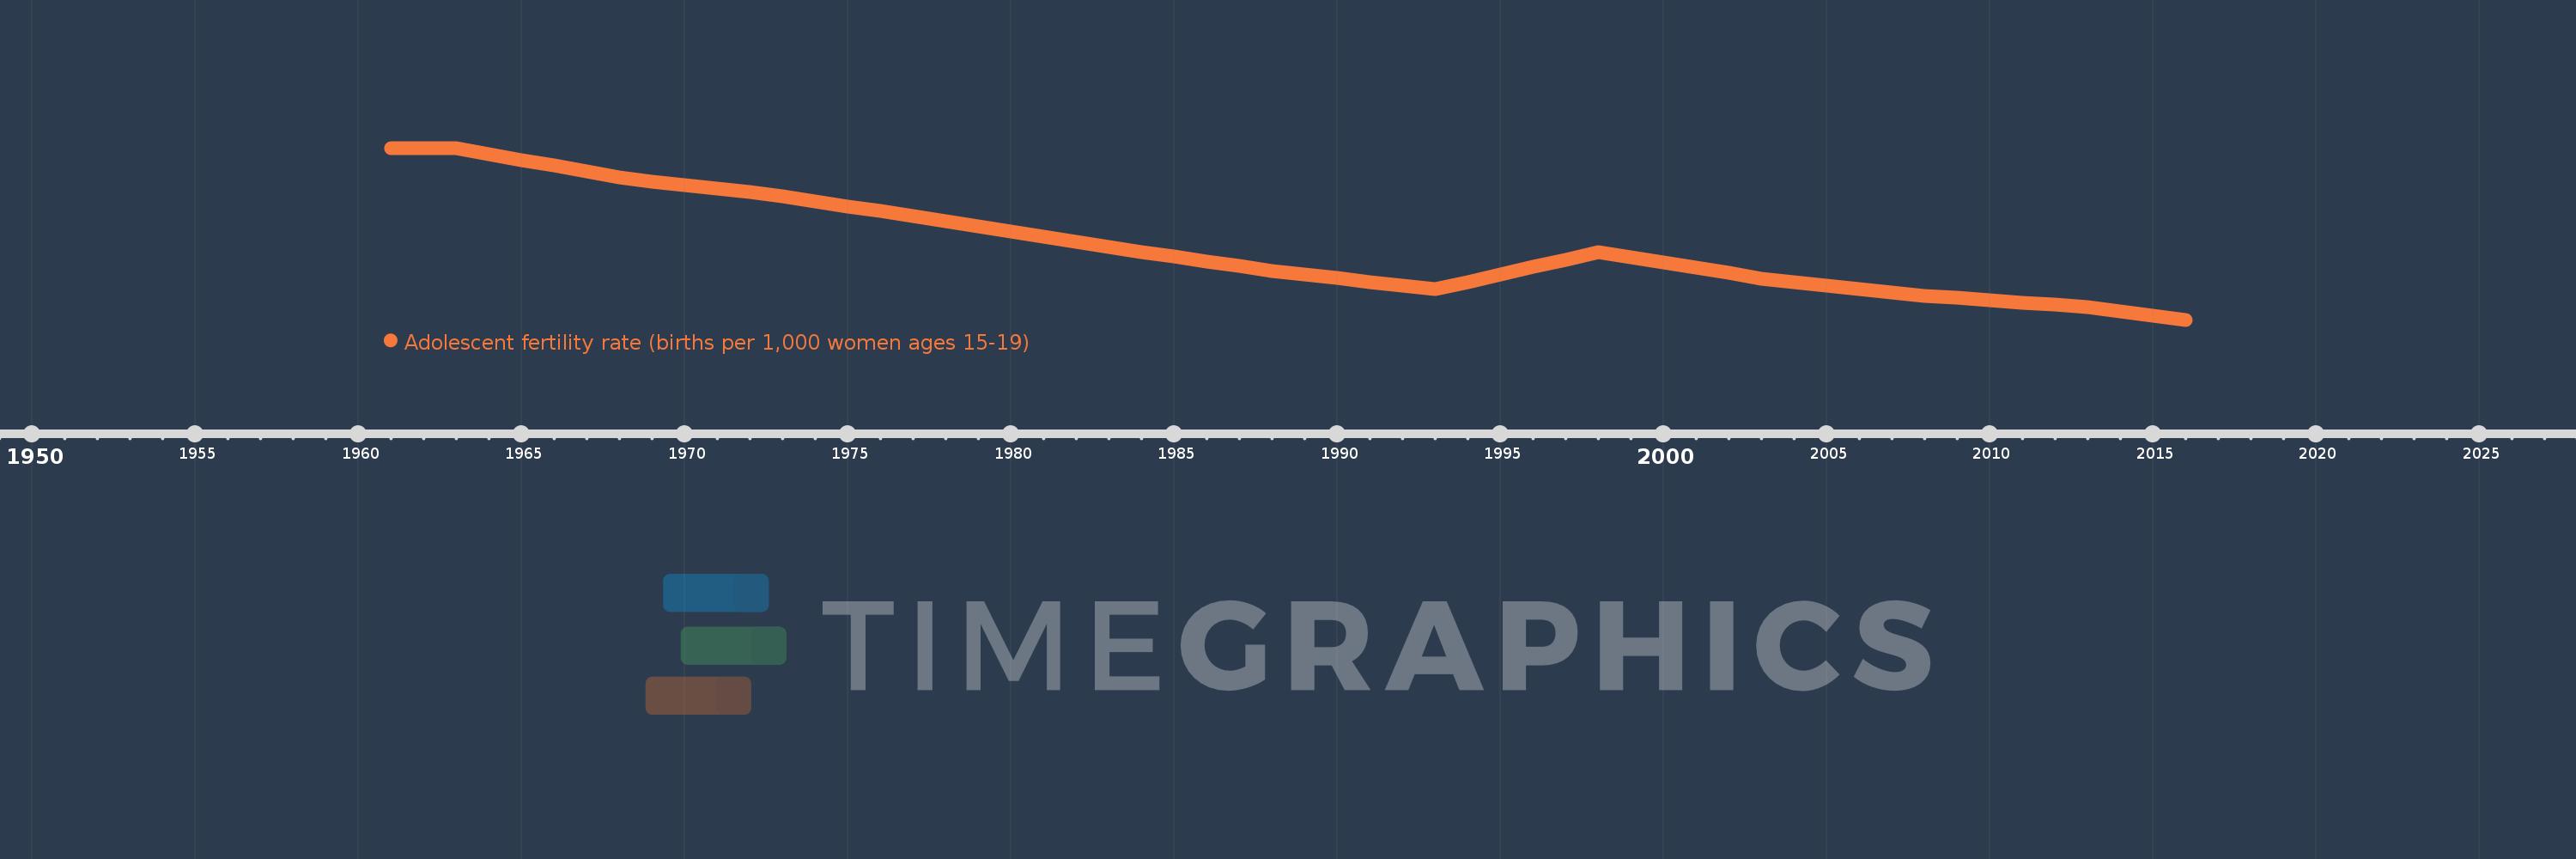
Adolescent fertility rate (births per 1,000 women ages 15-19)
2016,2015,2014,2013,2012,2011,2010,2009,2008,2007,2006,2005,2004,2003,2002,2001,2000,1999,1998,1997,1996,1995,1994,1993,1992,1991,1990,1989,1988,1987,1986,1985,1984,1983,1982,1981,1980,1979,1978,1977,1976,1975,1974,1973,1972,1971,1970,1969,1968,1967,1966,1965,1964,1963,1962,1961
This statistics in other country:
AfghanistanAlbaniaAlgeriaAngolaAntigua and BarbudaArab WorldArgentinaArmeniaArubaAustraliaAustriaAzerbaijanBahamas, TheBahrainBangladeshBarbadosBelarusBelgiumBelizeBeninBhutanBoliviaBosnia and HerzegovinaBotswanaBrazilBrunei DarussalamBulgariaBurkina FasoBurundiCabo VerdeCambodiaCameroonCanadaCaribbean small statesCentral African RepublicCentral Europe and the BalticsChadChannel IslandsChileChinaColombiaComorosCongo, Dem. Rep.Congo, Rep.Costa RicaCote d'IvoireCroatiaCubaCuracaoCyprusCzech RepublicDenmarkDjiboutiDominican RepublicEarly-demographic dividendEast Asia & PacificEast Asia & Pacific (excluding high income)East Asia & Pacific (IDA & IBRD countries)EcuadorEgypt, Arab Rep.El SalvadorEquatorial GuineaEritreaEstoniaEthiopiaEuro areaEurope & Central AsiaEurope & Central Asia (excluding high income)Europe & Central Asia (IDA & IBRD countries)European UnionFijiFinlandFragile and conflict affected situationsFranceFrench PolynesiaGabonGambia, TheGeorgiaGermanyGhanaGreeceGrenadaGuamGuatemalaGuineaGuinea-BissauGuyanaHaitiHeavily indebted poor countries (HIPC)High incomeHondurasHong Kong SAR, ChinaHungaryIBRD onlyIcelandIDA & IBRD totalIDA blendIDA onlyIDA totalIndiaIndonesiaIran, Islamic Rep.IraqIrelandIsraelItalyJamaicaJapanJordanKazakhstanKenyaKiribatiKorea, Dem. People’s Rep.Korea, Rep.KuwaitKyrgyz RepublicLao PDRLate-demographic dividendLatin America & Caribbean Latin America & Caribbean (excluding high income)Latin America & the Caribbean (IDA & IBRD countries)LatviaLeast developed countries: UN classificationLebanonLesothoLiberiaLibyaLithuaniaLow & middle incomeLow incomeLower middle incomeLuxembourgMacao SAR, ChinaMacedonia, FYRMadagascarMalawiMalaysiaMaldivesMaliMaltaMauritaniaMauritiusMexicoMicronesia, Fed. Sts.Middle East & North AfricaMiddle East & North Africa (excluding high income)Middle East & North Africa (IDA & IBRD countries)Middle incomeMoldovaMongoliaMontenegroMoroccoMozambiqueMyanmarNamibiaNepalNetherlandsNew CaledoniaNew ZealandNicaraguaNigerNigeriaNorth AmericaNorwayOECD membersOmanOther small statesPacific island small statesPakistanPanamaPapua New GuineaParaguayPeruPhilippinesPolandPortugalPost-demographic dividendPre-demographic dividendPuerto RicoQatarRomaniaRussian FederationRwandaSamoaSao Tome and PrincipeSaudi ArabiaSenegalSerbiaSeychellesSierra LeoneSingaporeSlovak RepublicSloveniaSmall statesSolomon IslandsSomaliaSouth AfricaSouth AsiaSouth Asia (IDA & IBRD)South SudanSpainSri LankaSt. LuciaSt. Vincent and the GrenadinesSub-Saharan Africa Sub-Saharan Africa (excluding high income)Sub-Saharan Africa (IDA & IBRD countries)SudanSurinameSwazilandSwedenSwitzerlandSyrian Arab RepublicTajikistanTanzaniaThailandTimor-LesteTogoTongaTrinidad and TobagoTunisiaTurkeyTurkmenistanUgandaUkraineUnited Arab EmiratesUnited KingdomUnited StatesUpper middle incomeUruguayUzbekistanVanuatuVenezuela, RBVietnamVirgin Islands (U.S.)West Bank and GazaWorldYemen, Rep.ZambiaZimbabwe Timeline:
This timeline shows a graph from 1961 to 2016 of Samoa. No data until 1960. Number of actual observations by date: 56.
Source name:
World Development Indicators
Source organization:
United Nations Population Division, World Population Prospects.
Categories, topics:
Health, Gender, Social Development
Last updated:
apr 23, 2017
Indicators value changes by year
Maximum:
77.147
jan 1, 1961
At the date of observation
Value
Absolute change
Change from previous value
jan 1, 1961
77.147
+77.147
0.0%
jan 1, 1962
77.146
-0.001
0.0%
jan 1, 1963
77.145
-0.001
0.0%
jan 1, 1964
75.318
-1.827
-2.37%
jan 1, 1965
73.491
-1.827
-2.43%
jan 1, 1966
71.665
-1.827
-2.49%
jan 1, 1967
69.838
-1.827
-2.55%
jan 1, 1968
68.011
-1.827
-2.62%
jan 1, 1969
66.887
-1.124
-1.65%
jan 1, 1970
65.763
-1.124
-1.68%
jan 1, 1971
64.639
-1.124
-1.71%
jan 1, 1972
63.515
-1.124
-1.74%
jan 1, 1973
62.391
-1.124
-1.77%
jan 1, 1974
60.809
-1.582
-2.54%
jan 1, 1975
59.227
-1.582
-2.6%
jan 1, 1976
57.645
-1.582
-2.67%
jan 1, 1977
56.063
-1.582
-2.74%
jan 1, 1978
54.481
-1.582
-2.82%
jan 1, 1979
52.897
-1.584
-2.91%
jan 1, 1980
51.313
-1.584
-2.99%
jan 1, 1981
49.73
-1.584
-3.09%
jan 1, 1982
48.146
-1.584
-3.18%
jan 1, 1983
46.562
-1.584
-3.29%
jan 1, 1984
45.128
-1.434
-3.08%
jan 1, 1985
43.693
-1.434
-3.18%
jan 1, 1986
42.259
-1.434
-3.28%
jan 1, 1987
40.824
-1.434
-3.39%
jan 1, 1988
39.39
-1.434
-3.51%
jan 1, 1989
38.246
-1.144
-2.9%
jan 1, 1990
37.102
-1.144
-2.99%
jan 1, 1991
35.957
-1.144
-3.08%
jan 1, 1992
34.813
-1.144
-3.18%
jan 1, 1993
33.669
-1.144
-3.29%
jan 1, 1994
35.954
+2.285
6.79%
jan 1, 1995
38.239
+2.285
6.36%
jan 1, 1996
40.524
+2.285
5.98%
jan 1, 1997
42.809
+2.285
5.64%
jan 1, 1998
45.094
+2.285
5.34%
jan 1, 1999
43.474
-1.62
-3.59%
jan 1, 2000
41.854
-1.62
-3.73%
jan 1, 2001
40.235
-1.62
-3.87%
jan 1, 2002
38.615
-1.62
-4.03%
jan 1, 2003
36.995
-1.62
-4.19%
jan 1, 2004
35.931
-1.064
-2.88%
jan 1, 2005
34.867
-1.064
-2.96%
jan 1, 2006
33.802
-1.064
-3.05%
jan 1, 2007
32.738
-1.064
-3.15%
jan 1, 2008
31.674
-1.064
-3.25%
jan 1, 2009
30.989
-0.685
-2.16%
jan 1, 2010
30.305
-0.685
-2.21%
jan 1, 2011
29.62
-0.685
-2.26%
jan 1, 2012
28.936
-0.685
-2.31%
jan 1, 2013
28.251
-0.685
-2.37%
jan 1, 2014
26.931
-1.32
-4.67%
jan 1, 2015
25.61
-1.32
-4.9%
jan 1, 2016
24.29
-1.32
-5.16%
Ranking of countries by current statistics by years


Comments: